Difference between revisions of "ISSS608 2017-18 T3 Assign Sun Shuangtian Kasios’ Recording Investigation"
Stsun.2017 (talk | contribs) |
Stsun.2017 (talk | contribs) |
||
| Line 50: | Line 50: | ||
[[File:Song3.png|600px|center]] | [[File:Song3.png|600px|center]] | ||
[[File:Song4.png|600px|center]] | [[File:Song4.png|600px|center]] | ||
| − | [[File: | + | [[File:STSong1.jpg|600px|center]] |
</table> | </table> | ||
</div> | </div> | ||
Revision as of 19:56, 8 July 2018
|
|
|
|
|
|
|
|
Contents
Geospatial distribution of the recordings
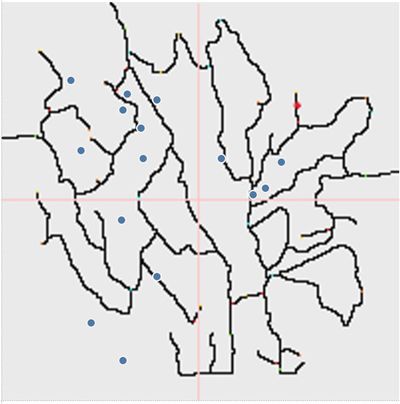
In our previous analysis, we could visualize the Rose-crested Blue Pipits in the Preserve appears mostly in northeast of the Preserve. Whereas according to the recordings provided by Kasios, Blue Pipits appears around the whole Preserve. This make us doubt the authenticity of the Blue Pipit recordings. Further analysis needs to be done to identify if the recording provided by Kasios are really the call of Blue Pipit.
Spectrogram in R
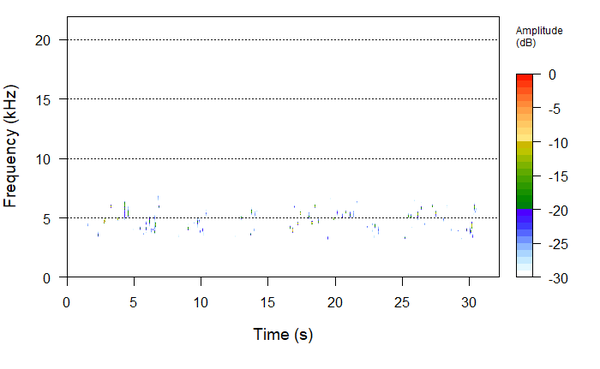
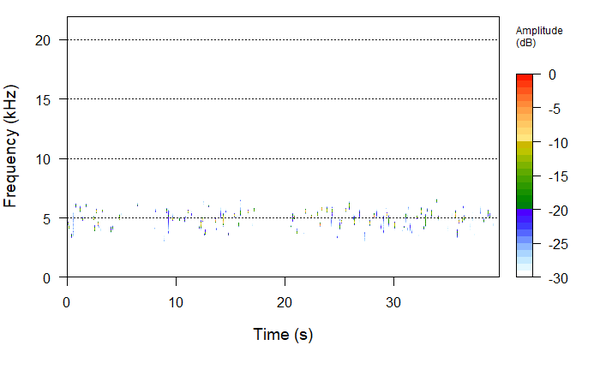
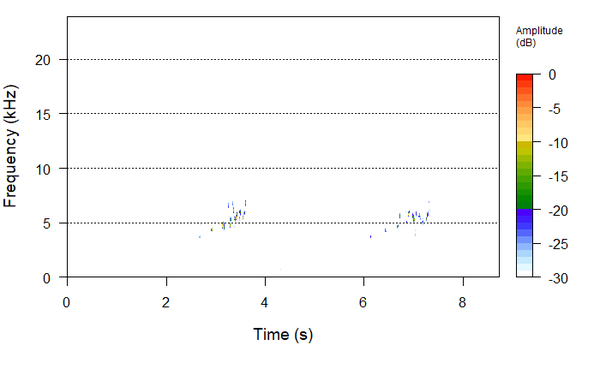
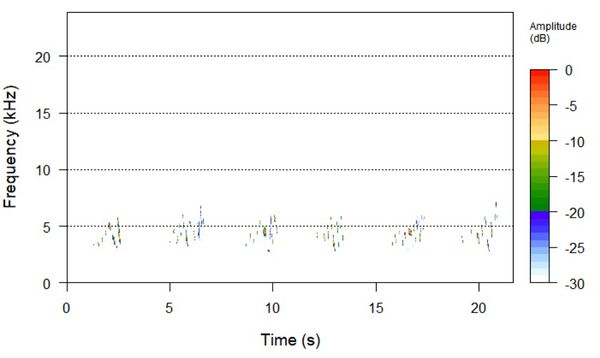
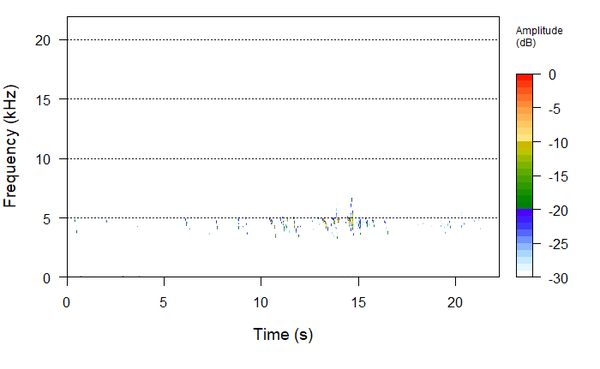
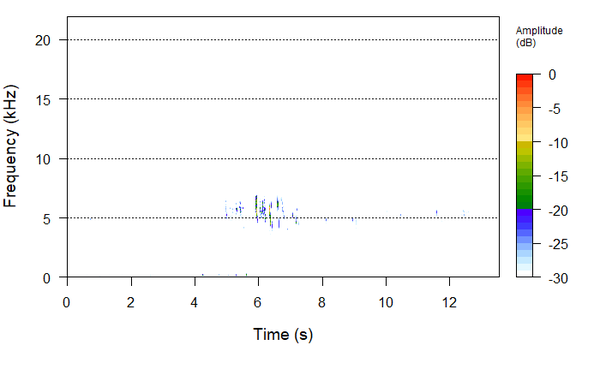
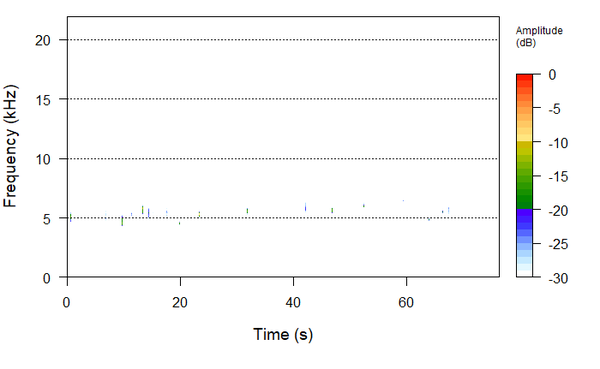
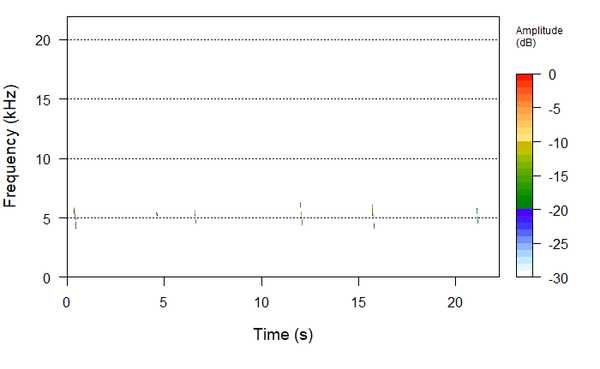
In the collection of bird calls from the Preserve which has accurate identifications, we randomly choose 4 Rose-crested Blue Pipit Song recordings and 4 Rose-crested Blue Pipit Call recordings. Then we use R package seewave to break the recording and detect the frequencies respectively.
Song frequency of Blue Pipit
Call frequency of Blue Pipit
Pattern Summary
From the spectrogram above We could conclude that he frequency of Blue Pipit songs and calls are both around 5KHz.

