Difference between revisions of "ISSS608 2017-18 T3 Assignment SHI CHEN Visualization"
| Line 181: | Line 181: | ||
Trying to install measuring instruments near the factory to measure close-range indicators, and secondly to set long-distance measuring points. This makes it easy to compare the magnitude of the change in measured values at different distances. | Trying to install measuring instruments near the factory to measure close-range indicators, and secondly to set long-distance measuring points. This makes it easy to compare the magnitude of the change in measured values at different distances. | ||
Increase information of other indicators: There is a need for more comprehensive factory construction, production of products, changes in bird migration sites and changes in their food. | Increase information of other indicators: There is a need for more comprehensive factory construction, production of products, changes in bird migration sites and changes in their food. | ||
| + | |||
| + | ==<font color = "#326569">Comment</font>== | ||
| + | <div style="font-family:Segoe UI Light; font-size:100%; padding: 0px 0px 0px 15px;"> | ||
| + | <div style="font-family:Segoe UI;"> | ||
| + | <font size = 3; color ="#0F334D | ||
| + | "> | ||
| + | This assignment may be a little inadequate. | ||
| + | |||
| + | Welcome and leave your comments below if you have any thoughts or improvements! | ||
| + | |||
| + | Thank you! | ||
| + | 👇 | ||
Latest revision as of 18:18, 8 July 2018
|
|
|
|
|
|
Contents
Question 1
Question Description
Characterize the past and most recent situation with respect to chemical contamination in the Boonsong Lekagul waterways. Do you see any trends of possible interest in this investigation?
Analysis
* Overall chemical value level:
I characterize the time periods into two, one is 1998-2013 so called “earlier years”, another is 2014-2017, which is “recent year”.
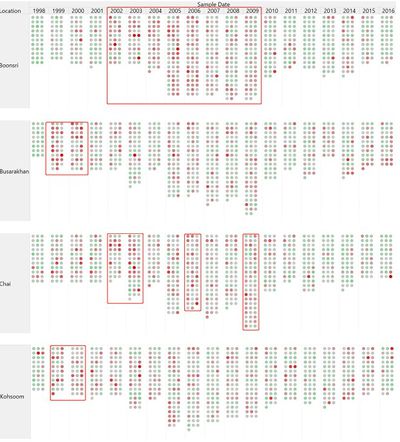
Based on the total chemical value in these streams throughout the past available years, as the year changes, the material content of the river shows an upward trend, with 2003 being the most serious year.
Looking closely, in earlier period of years, location Kohsoom, Busarakhan, Somchair had the higher chemical value, and Boonsri, Chai, and Sakda are lower. In recent years, chemical monitoring levels have declined in almost all locations, with the exception of the location Tansanee, the chemical content of this location has been at a high level.
Presumably1: Based on this situation, we can temporarily speculate that location Kohsoom, Busarakhan, Somchair may be subject to serious pollution in 2013, especially for the Kohsoom location.
Presumably2: Since Achara, Decha and Tansanee were added as observation station since 2009, it can be roughly speculated that these three location could be seen as dumping area too, since the chemical value in 2009 were much higher than other location in the same year. And the hydrological department added these three observation points in order to obtain a more accurate source of pollution.
* Finding out anomaly in past years.
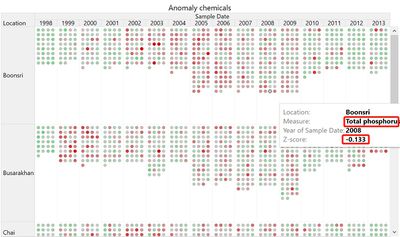
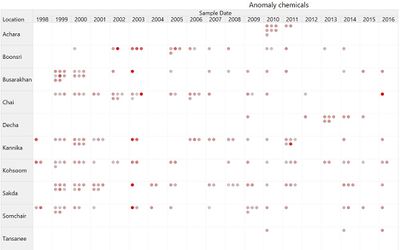
This scatter plot graph has been shown in the front dashboard design section. Now it can be used to see which chemicals have higher volatility and how did they fluctuate. When do filtering, let’s say if choosing z-score with larger than 2. It will be clearer to see the anomaly chemicals distribution. In this case, I would like to see those chemicals with volatility from 2 and above to look deeper. Drag the Z-score slider.
Above chemicals were more likely to be anomaly.
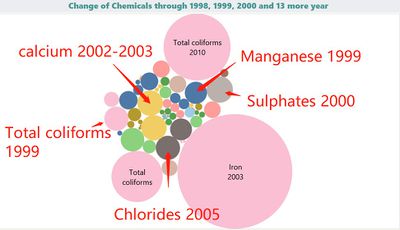
Earlier year condition: I don't look at the area first. When I determined the range of fluctuation values, I framed these points before 2013. According to the graph below, “iron”, “total coliforms”, “total coliforms” have greater average value, followed by “calcium”, “chlorides”, “Sulphates” and so on. So these chemicals fluctuated abnormally in the early years.
Recent years condition:
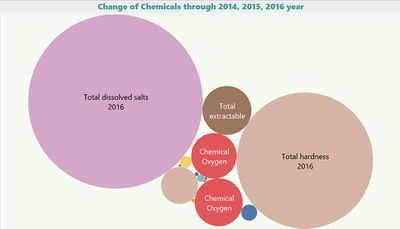
Choosing the dots from 2014 to 2016. Results are showing like this. “Total dissolved salts” has the largest average value, followed by “total hardness”, “Chemical Oxygen”.
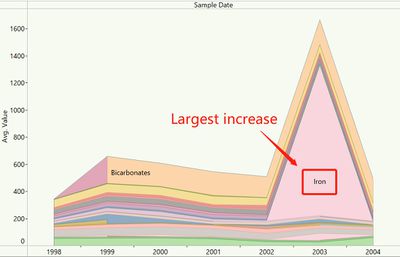
* Remember what was mentioned in the previous analysis: in 2003, almost all locations had a sharp increase in chemical value. What happened to 2013?
Throughout area chart, the overall “iron” value had the most significant rise in this basin (the pink part) than any other chemicals, from 107(1998) to 218508 (2003).
Question 2
Question Description
What anomalies do you find in the waterway samples dataset? How do these affect your analysis of potential problems to the environment? Is the Hydrology Department collecting sufficient data to understand the comprehensive situation across the Preserve? What changes would you propose to make in the sampling approach to best understand the situation?
Analysis
* Finding out any relationship between the upstream and downstream chemical value changes. Is the downstream chemical value level greater than the upstream?
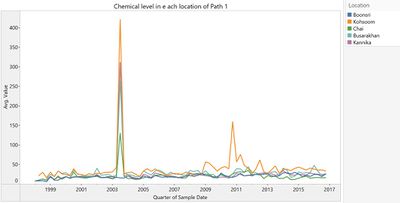
Path1:
Upstream chemicals do not all flow to downstream. It is the upstream part of a tributary and technically the chemical value should be less than the downstream. This location may be very close to the location where the contaminants are dumped.
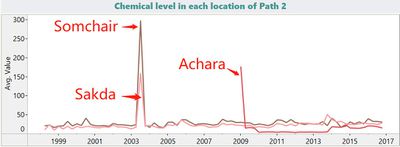
Path2:
Chemical value level in upstream part Somchair were higher than its downstream Sakda. It indicated that dumping were more serious in Somchair area. Before and 2009, there would be a dumping issue in Achara. But since 2009, the environmental problems in Achara has become better.
Insight: The chemical changes in the upstream and downstream are not consistent. We can use this phenomenon to speculate that there may be problems with the dumping of pollutants in some areas.
* Anomalies being found in the waterway samples dataset.
(1) Hydrological department had a large difference in the number of measurements taken at different locations in different rivers.
(2) Staff member in department measured three times in one day and the results were totally different.
There are 19660 records that department measure a particular chemicals in one day for multiple times.
Taking AGOC-3A measurement as an example. The results for the 3 times of detection didn’t consistent. Insight: This shows that the measurement of a substance on the same day at the same place is actually very different.
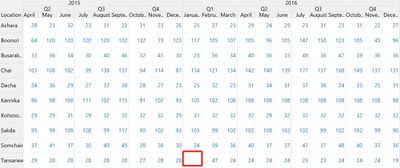
(3) There are some missing data in certain quarter.
Looking into the number of chemical measurements. There is missing records in 2016 Q1. For measurements, both the frequency of the measurement and the change in the measured substance may skew the results.
The data problem would make the results biased or incomplete since the data used to prove are less.
* The types of chemicals measured by the hydrological department in different years are also different. Especially in the last two years, the types of measurements have been reduced.
We can observe that in recent years, the number of types of chemicals being detected are actually similar to the ending 20th century level.
Insight:The type of measurement and the frequency of measurement were larger from 2005 to 2009, which may indicate that pollution problems are highlighted during this time. In recent years, there should be some improvement, and the changes in chemical substances are relatively stable, but it is necessary to observe the A area specifically because there are still a lot of abnormal substances in this place.
Question 3
Question Description
After reviewing the data, do any of your findings cause concern for the Pipit or other wildlife? Would you suggest any changes in the sampling strategy to better understand the waterways situation in the Preserve?
Analysis
* Below indicators might be cause concern for the Pipit and other wildlife.
(1) Chemicals
Some chemicals like Nitrates, Nitrites as well as the high value of iron, had negative influence on birds.
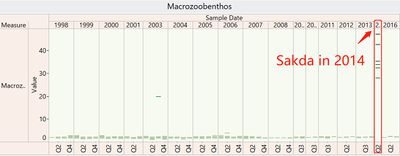
(2) Macrozoobenthos
According to academic articles, this benthic animal is related to river circulation
Sakda in 2004 should have good connectivity. However, this phenomenon may cause potential problems for the number of birds inhabited, and the flow of the river may cause the pollutants to spread rapidly.
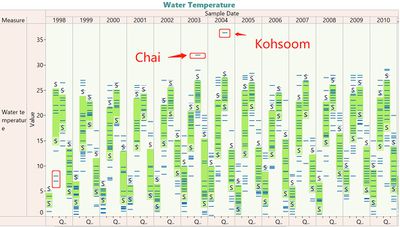
(3) Water Temperature:
Although hydrology is seasonally fluctuating, extreme values appear at these points, which may affect the habitat of birds.
* Possible sampling approach:
Existing limitations:
Since this time, we only focus on water sensor readings from rivers and streams in the preserve, there are limitations to relying solely on this approach. First, the topsoil is believed to have been destroyed, causing some indicators of pollutants to be altered. Second, contaminated soil may be far from the river and may not completely infiltrate into the river, especially when encountering more complex terrain. In another case, contaminants may be absorbed by some microorganisms in the soil.
Increase measurement method:
the water quality measurement of the river may make the source of the pollutants fuzzier, it is recommended to increase the measurement of the riverbed soil.
Increase measurement location:
Trying to install measuring instruments near the factory to measure close-range indicators, and secondly to set long-distance measuring points. This makes it easy to compare the magnitude of the change in measured values at different distances. Increase information of other indicators: There is a need for more comprehensive factory construction, production of products, changes in bird migration sites and changes in their food.
Comment
This assignment may be a little inadequate.
Welcome and leave your comments below if you have any thoughts or improvements!
Thank you! 👇
