Difference between revisions of "ISSS608 2016-17 T3 Assign Chen Fan Conclusion"
| Line 41: | Line 41: | ||
I think we need to know whether there are other factories in this Preserve; And whether the root of the water have some changes so the water condition becomes different with time goes by; And population density in this region we should also know because human activity will have a huge influence in environment; Government’s approach to manage this region; measure value should be calculated in all the sample place, can’t calculate in one place but in other place not. | I think we need to know whether there are other factories in this Preserve; And whether the root of the water have some changes so the water condition becomes different with time goes by; And population density in this region we should also know because human activity will have a huge influence in environment; Government’s approach to manage this region; measure value should be calculated in all the sample place, can’t calculate in one place but in other place not. | ||
| − | === | + | ===Concerns for Wildlife=== |
(1) Some of the toxin metal increased with year goes by. | (1) Some of the toxin metal increased with year goes by. | ||
For example, the Arsenic [https://public.tableau.com/views/ConcernforWildlife/Arsenic?:embed=y&:display_count=yes&publish=yes]: | For example, the Arsenic [https://public.tableau.com/views/ConcernforWildlife/Arsenic?:embed=y&:display_count=yes&publish=yes]: | ||
Latest revision as of 11:29, 8 July 2018
|
|
|
|
|
Conclusion
Inference
From the analysis result: It can be inferred that the ranger station has influence on the waterway conditions because the Methylosmolene (the toxic manufacturing chemical in the suspected dumping) value and Chlorodinine value is far more higher in Kohsoom(near suspected dumping place) than other places.
Data Anomalies
(1) Recording Mistake For iron, the value can’t reach 30000 mg/l, it can’t be true, and this mistake only appear in 15/8/2003, so we can delete or replace it, because we use the average value, doesn’t have much influence in our analysis of potential environment problems.
(2) Incomplete Data Some of the measures appear only in certain years and in other years, we don’t have sufficient data to analyse the trend or the change of these measure. It will influence our analysis. For different region, some measure value didn’t record. Eg:Methylosmoline only recorded in these 7 regions and other region didn’t. it will influence the location analysis of the environment problems.
Hydrology Department didn’t collect sufficient data to understand the comprehensive situation across the Preserve. These data are not enough to analyse the situation in the Preserve. I think we need to know whether there are other factories in this Preserve; And whether the root of the water have some changes so the water condition becomes different with time goes by; And population density in this region we should also know because human activity will have a huge influence in environment; Government’s approach to manage this region; measure value should be calculated in all the sample place, can’t calculate in one place but in other place not.
Concerns for Wildlife
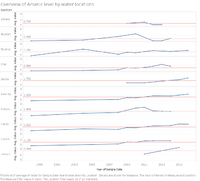
(1) Some of the toxin metal increased with year goes by. For example, the Arsenic [1]:
This is the Arsenic value change with time goes by, we can see recent years the Arsenic value increased and have a high chance to increase in the future, this will harm the presence of the wildlife.
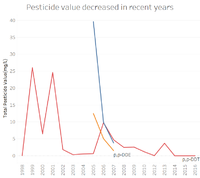
(2) Good news for wildlife [2].
DDD, DDE and DDT pesticide value once very high, but decreased with time, now close to zero.We can infer that in 2005-2007, these pesticide are frequently used but get good management, people no more use it.
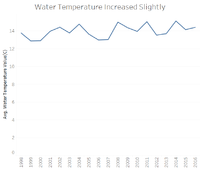
(3) Water temperature increased [3].
This picture shows in different year, the average water temperature. We can see the temperature although increased slightly, but with time goes, it will have a huge influence for the wildlife. So Greenhouse effect still a big problem for us.
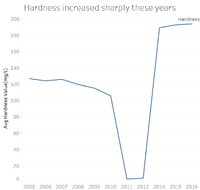
(4) Total hardness increased [4].
As we can see, the average hardness increased sharply from 2014-2016. And especially high in 2016. Higher hardness water is harmful to wildlife.
For better strategy in getting the water sampling, I think we should get the sample from both upstream and downstream, if it has a huge different, it may be influenced by the factory in the middle way; and we should get the water from the hydrostatic layer, so the data will be more stable and reliable; To get as much sample as possible to reduce the accidental error; and we should get the samples from more location, which will help us to do the comparation.


