|
|
| Line 11: |
Line 11: |
| | | style="font-family:Century Gothic; font-size:100%; solid #1B338F; background:#FFF0F5; text-align:center;" width="25%" | | | | style="font-family:Century Gothic; font-size:100%; solid #1B338F; background:#FFF0F5; text-align:center;" width="25%" | |
| | ; | | ; |
| − | [[ISSS608 2017-18 T3 Assign Alejandro Llorens Moreno_Data_Preparation|<b><font size="4"><font color="#8B4513">Methodology & Dashboard Design</font></font></b>]] | + | [[ISSS608 2017-18 T3 Assign Alejandro Llorens Moreno_Data_Preparation|<b><font size="4"><font color="#8B4513">Methodology </font></font></b>]] |
| | | | |
| | | style="font-family:Century Gothic; font-size:100%; solid #1B338F; background:#FFF0F5; text-align:center;" width="25%" | | | | style="font-family:Century Gothic; font-size:100%; solid #1B338F; background:#FFF0F5; text-align:center;" width="25%" | |
Revision as of 15:38, 7 July 2018
 VAST Challenge 2017:Mystery at the Wildlife Preserve
Methodology & Dashboard Design
Methodology
| Description |
Illustration |
| 1.Selecting the right chemicals
Pollution in the waters of the reserve is defined by many measures but the data set only provides enough data for a set of measures
|
|
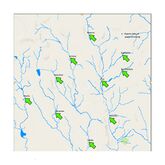
| 2.Visualizing the overall trends
The chemical measures were visualized per quarter and year vs Location. This helps understand the trend for each selected chemical
|
|
| 3.Understand the hottest months
The data provided is all about the chemicals taking the readings and the date and time when the readings were taken (timestamps). This provides valuable information on the paths adopted by different vehicles inside the preserve – where did they go and what time did they go. Thus, one of the core patterns of life analysis will be centered around the paths adopted by different types of visitors identified in 1.
Two terminologies used in the analysis need to be clarified before we move on to the analysis result, paths vs sequences.
In this analysis, a path is defined as a series of categories of gates visited by different vehicles in a chronological order. The path analysis looks at the movement in the reserve at a broader level, for example, how many visitors following the movement pattern of entrance->camps->entrance. In this case, a vehicle moves from entrance1 ->camp1->entrance3 will be taken as being traveled along the same path as a vehicle which moves from entrance2 ->camp1->entrance4. Here, we are interested in HOW the vehicles move around the park.
On the other hand, a sequence is defined as the series of individual gates visited by different vehicles in the chorological order. Taking the same path example given above, now in the sequence analysis we’ll consider the two vehicles as being travelled by different sequences. Now we are interested in WHERE the vehicles move around the park at different time periods.
|
The paths:
The sequences:
|
| 4.Interpretations on "patterns of life" analysis
For the daily patterns, we look at the activities of different types of vehicles at different hours of the day – what time they go to the reserve, what time they leave and where do they go at different hours.
For the longer period patterns, we look at the activities of different types of vehicles at specific day of week, day of month or months.
For the visualization design, an interactive date parameter is introduced to allow the users to switch between different time periods to be used for the analysis easily.
|
|
| 5.Overall visualization design concepts
6 types of visitors, 5 categories of gates and 3 time intervals for analysis – this challenge deem to be an intriguing one. Thus, the visualizations were designed make full use of Tableau’s interactivity such that we can provide a tool for the users to customize their analysis as much as possible. The users are able to filter the different input parameters (visitor type, gates, time), choose the extent of animation (for the paths) and choose what is the area of focus for the analysis by playing with the colors. This will be explained in greater details in the dashboard designs section.
|
Dashboard Design
View the interactive Tableau design here: Link to tableau dashboard
1.Activity Overview -- provide an activity overview on the size of traffic at various checkpoints in the reserve over the entire year
2.Pattern Analysis -- to visualize the daily and longer period patterns of life in the reserve
3.Path Analysis -- to visualize the most frequently travelled paths and sequences
4.Movement Anomaly --to discover unusual movements in the reserve
5. Duration Anomalies --to discover the outliers in terms of stay duration
•Total checked: the total number of stops each tourist went
•Total visited: the number of distinct stops each tourist went Car Type
 VAST Challenge 2017:Mystery at the Wildlife Preserve

