Difference between revisions of "Group14 Proposal"
Kalaisr.2017 (talk | contribs) |
Kalaisr.2017 (talk | contribs) |
||
| Line 4: | Line 4: | ||
<!------- Main Navigation Bar----> | <!------- Main Navigation Bar----> | ||
<center> | <center> | ||
| − | {| style="background-color:# | + | {|style="background-color:#00CED1;" width="100%" cellspacing="0" cellpadding="0" valign="top" border="3" | |
| − | | style="font-family:Open Sans, Arial, sans-serif; font-size:15px; text-align: center; border-top:solid #ffffff; border-bottom:solid # | + | | style="font-family:Open Sans, Arial, sans-serif; font-size:15px; text-align: center; border-top:solid #ffffff; border-bottom:solid #ffffff" width="190px" | |
| − | [[Home|<font color="# | + | [[Home|<font color="#ffffff"><strong>OVERVIEW</strong></font>]] |
| − | | style="font-family:Open Sans, Arial, sans-serif; font-size:15px; text-align: center; border-top:solid #ffffff; border-bottom:solid # | + | | style="font-family:Open Sans, Arial, sans-serif; font-size:15px; text-align: center; border-top:solid #ffffff; border-bottom:solid #ffffff" width="210px" | |
| − | [[Proposal|<font color="# | + | [[Proposal|<font color="#ffffff"><strong>PROPOSAL</strong></font>]] |
| − | | style="font-family:Open Sans, Arial, sans-serif; font-size:15px; text-align: center; border-top:solid #ffffff; border-bottom:solid # | + | | style="font-family:Open Sans, Arial, sans-serif; font-size:15px; text-align: center; border-top:solid #ffffff; border-bottom:solid #ffffff" width="210px" | |
| − | [[Poster|<font color="# | + | [[Poster|<font color="#ffffff"><strong>POSTER</strong></font>]] |
| − | | style="font-family:Open Sans, Arial, sans-serif; font-size:15px; text-align: center; border-top:solid #ffffff; border-bottom:solid # | + | | style="font-family:Open Sans, Arial, sans-serif; font-size:15px; text-align: center; border-top:solid #ffffff; border-bottom:solid #ffffff" width="230px" | |
| − | [[Project Application|<font color="# | + | [[Project Application|<font color="#ffffff"><strong>APPLICATION</strong></font>]] |
| − | | style="font-family:Open Sans, Arial, sans-serif; font-size:15px; text-align: center; border-top:solid #ffffff; border-bottom:solid # | + | | style="font-family:Open Sans, Arial, sans-serif; font-size:15px; text-align: center; border-top:solid #ffffff; border-bottom:solid #ffffff" width="230px" | |
| − | [[Research Paper|<font color="# | + | [[Research Paper|<font color="#ffffff"><strong>RESEARCH PAPER</strong></font>]] |
| − | | style="font-family:Open Sans, Arial, sans-serif; font-size:15px; text-align: center; border-top:solid #ffffff; border-bottom:solid # | + | | style="font-family:Open Sans, Arial, sans-serif; font-size:15px; text-align: center; border-top:solid #ffffff; border-bottom:solid #ffffff" width="230px" | |
| − | [[Research Paper|<font color="# | + | [[Research Paper|<font color="#ffffff"><strong>BACK TO HOMEPAGE</strong></font>]] |
|} | |} | ||
</center> | </center> | ||
Revision as of 18:42, 17 June 2018
Overview
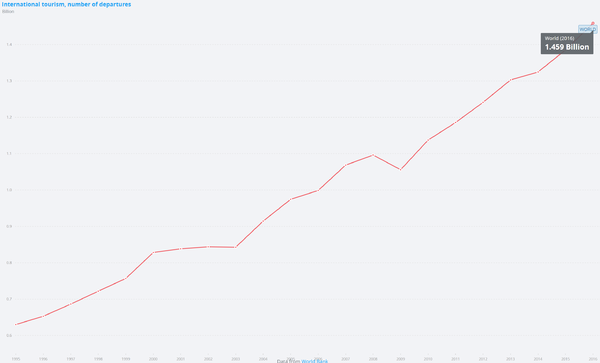
In 2016, there were 1.459 billion departures made by international outbound tourists from their country of usual residences, which was an increase of 46% from the 999 million departures in 2006, in a span of 10 years.[1]
International Tourism, Number of Departures from 1995 to 2016
|
|
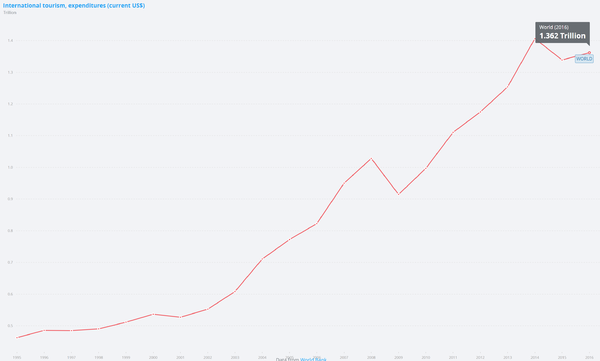
Additionally, the tourism industry has contributed significantly to the world’s economy, where the recorded expenditure of international outbound tourists in other countries amounted to USD 1.362 trillion[2].
International Tourism, Expenditures (Current US$) from 1995 to 2016
|
|
A key factor that has contributed significantly to the tourism industry is the rise of the sharing economy. According to UNWTO (2017), the sharing economy is “the sharing of access to goods and services from peer-to-peer / private-to-private coordinated through community-based online services”. Despite having a business model that deviates from the conventional hospitality business strategy, Airbnb, a platform which allows peer-to-peer hosting and rental of private homes, has become a significant player in the hospitality industry.
However, we understand that there are various social and environmental implications that comes with the growing global hospitality business. Prior researches have shown that there is a relationship between crime and public disorder, and tourism[3], and tourists are often the victims of these crimes.[4]
Therefore, this project aims to create a visualisation of the spatial relationship between crime and hospitality, and to delve deeper into understanding the difference in the relationship between crime and the conventional hospitality business – Hotels and Hostels, and between crime and Airbnb. Additionally, this project will drill down into visualizing the different types of crimes that are most spatially related to the different categories of hospitality business.
Motivation
To ensure a sustainable development of the tourism industry by decreasing the levels of crime and victimization of tourists should be of the utmost concern of policy-makers. We hope that by initializing the visualization of the effects of tourism on crime and public disorder on a local level, greater awareness towards this problem will be achieved, and interoperability between local governmental agencies will be encouraged to address this issue.
Objectives
Through our analysis, we hope to address the following:
1) To explore the Relationship between Spatial Configuration and Crime Rates
We want to find out if the criminal rates differ between spatial areas close to Hotels and Airbnb.
2) To determine if there is a difference in the type of criminal activities and offences committed between spatial areas close to Airbnb versus Hotels.
3) Analyse Crime patterns by Day versus Night Crime; Weekday versus Weekend Crimes between Hotels and Airbnb
Explore if the timings and frequency of criminal activities and offences committed differ between spatial areas close to Airbnb versus Hotels.
Data Sources
| Type | Description | Source |
| Demographics | Detailed Aribnb Listings data for London | |
| Demographics | Detailed listing of Street-level crime data in London | https://data.police.uk/data/ |
| Demographics | Detailed listing of Hotels in London |
Tools and Packages
• rshiny
• ggmap
• leaflet
• tmap
• shinydashboard
• mapview
• rgdal
• rgeos
• dplyr
• spatialPosition
References
[1] The World Bank. https://data.worldbank.org/indicator/ST.INT.DPRT?end=2016&start=1995
[2] The World Bank. https://data.worldbank.org/indicator/ST.INT.XPND.CD?end=2016&start=1995
[3] R. I. Mawby. Crime and disorder, security and the tourism industry. In Handbook of Security; Gill, M., Ed.; Palgrave-Macmillan: London UK, 2014; pp. 383-403
[4] Mawby, R. I.; Brunt, P.; Hambly, Z., Victimization on holiday: A British survey. Int. Rev. Vict. 1996, 6, 201-211
[5] R. I. Mawby et al, 2016. Addressing the Security Concerns of Locals and Visitors for the Sustainable Development of Tourist Destinations


