Difference between revisions of "Group13 Proposal"
Jump to navigation
Jump to search
| Line 53: | Line 53: | ||
<p> | <p> | ||
1. <b>Driving Forces behind Climate Change</b>: | 1. <b>Driving Forces behind Climate Change</b>: | ||
| − | + | Through interactive visualization, we aim to study trends in potential economic, science and technology, and climate change indicators over the last 2 decades. We will try to uncover relationship between economic activities and climate over the years. | |
</p> | </p> | ||
<p> | <p> | ||
Revision as of 17:06, 17 June 2018

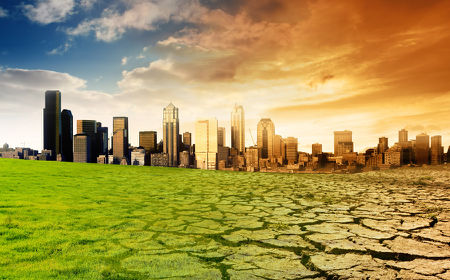
Economic Growth And Climate Change
|
|
|
|
|
Introduction
TBC
Motivation
TBC
Main Objectives
1. Driving Forces behind Climate Change: Through interactive visualization, we aim to study trends in potential economic, science and technology, and climate change indicators over the last 2 decades. We will try to uncover relationship between economic activities and climate over the years.
2.Develop a Predictive Policing Visual Tool:
Visualization Tools
For our analysis, we propose to do interactive visualization using Tableau, R, and Python. Below is a list of tools, we will try to explore for our analysis:
- Gephi
- GGPLOT
- R-Shiny
- Tidyverse
- Plotly
Dataset Description
TBC
Data Dictionary
TBC
References
TBC