Difference between revisions of "Huang Yiyun Data Preparation"
Jump to navigation
Jump to search
(Created page with "<div style=background:#2B3856 border:#A3BFB1> 300px <font size = 6; color="#FFFFFF">ISSS608 Assignment Huang Yiyun - MC2 </font> </div> <!--MAIN HEADER...") |
|||
| Line 43: | Line 43: | ||
*There is no missing data in "Boonsong Lekagul waterways readings.csv" dataset, but there is only one missing value in "chemical units of measure.csv" dataset, I just deleted it.<br>[[File: missing1.png|600px|center]][[File: missing2.png|600px|center]] | *There is no missing data in "Boonsong Lekagul waterways readings.csv" dataset, but there is only one missing value in "chemical units of measure.csv" dataset, I just deleted it.<br>[[File: missing1.png|600px|center]][[File: missing2.png|600px|center]] | ||
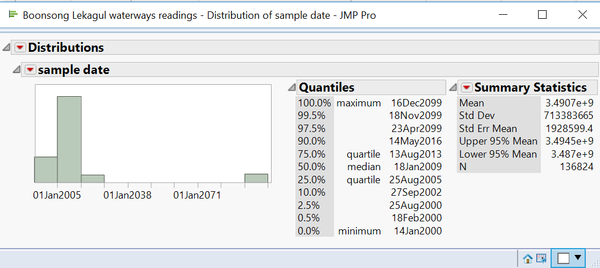
*There are some sample dates need to recode.I recoded 2098 to 1998 and 2099 t0 1999.<br>[[File: Sampledates.png|600px|center]] | *There are some sample dates need to recode.I recoded 2098 to 1998 and 2099 t0 1999.<br>[[File: Sampledates.png|600px|center]] | ||
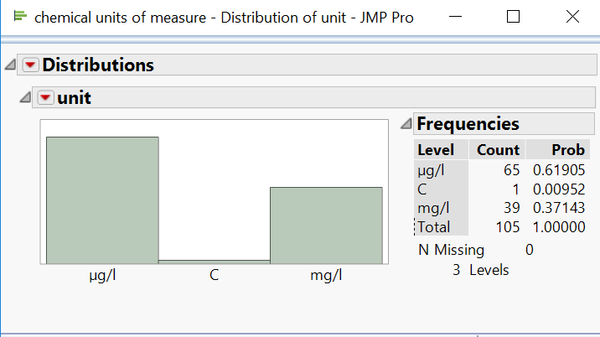
| − | In "chemical units of measure.csv", units are different,such as mg/l and μg/l. | + | In "chemical units of measure.csv", units are different,such as mg/l and μg/l, which need to be consistent.<br>[[File: units.png|600px|center]] |
|- | |- | ||
| | | | ||
| − | + | Excel | |
|| | || | ||
| − | |||
| − | |||
| − | |||
| − | |||
| − | |||
| − | |||
| − | |||
| − | |||
| − | |||
| − | |||
| − | |||
| − | |||
| − | |||
| − | |||
| − | |||
| − | |||
| − | |||
| − | |||
| − | |||
| − | |||
| − | |||
| − | |||
| − | |||
| − | |||
| − | |||
| − | |||
Latest revision as of 23:41, 19 August 2018
|
|
|
|
|
|
Tool |
Approach |
Findings |
|
JMP |
Data Exploration |
|
|
Excel |


