Difference between revisions of "Group19 Report"
| Line 243: | Line 243: | ||
|} | |} | ||
<!--Limitations and Future Work--> | <!--Limitations and Future Work--> | ||
| − | |||
| − | |||
| − | |||
| − | |||
| − | |||
| − | |||
| − | |||
| − | |||
| − | |||
| − | |||
| − | |||
<!--Acknowledgements--> | <!--Acknowledgements--> | ||
Revision as of 21:39, 14 August 2018
LINK TO PROJECT GROUPS:
Please Click Here -> [1]
Sex Ratio At Birth in China
|
|
|
|
|
Contents
Introduction
Based on “The Global Gender Gap Report 2017”, China remains the world’s lowest ranked country with regard to the gender gap in its sex ratio at birth (SRB). Tracing back to previous census data and demographic statistics, sex ratio at birth in China has been on the high side since the early 1980s and rising continuously. “In the human species the ratio between males and females at birth is slightly biased towards the male sex. The natural “sex ratio at birth is often considered to be around 105. This means that at birth on average, there are 105 males for every 100 females.” “The sex ratio of total population is expected to equalize at 0.9445(female-to-male ratio). In the third, fourth, fifth and sixth China population censuses, the sex ratios at birth in China is 108.5, 111.3, 116.9 and 118.1, respectively. China has become the populous nation with highest sex ratio at birth and in most serious gender imbalance situation. |
Objective and Motivations
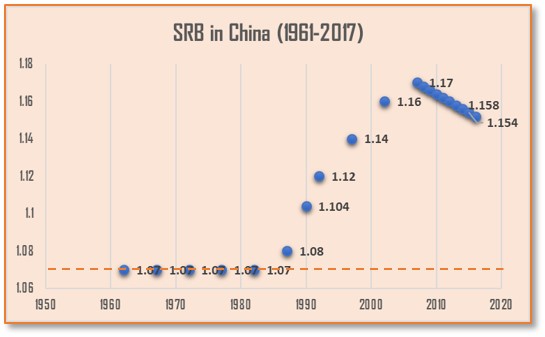
The project aims to use visualization and show the sex ratio at birth in China in different aspects and try to find out the socio-economic and cultural factors that leading to the increase of the sex ration at birth, which may be meaningful to curb the increase of birth sex ratio and restore it to normal level. If we check the SRB in China from 1961-2017, we can find that:
|
Dataset and Data Preparation
DatasetThe population data (SRB) are from the China 6th national population census. (2009-2010) Data for Economy, education, public health are from China Statistical Year book 2010. Indicators includes, per capita disposable income (city, rural), Proportion of population with high school degree or above (female and male), Agricultural population ratio, Proportion of the population of ethnic minorities, average number of beds in health institutions (per 1000), birth rate (rural, city), The proportion of second and above births.
Data PreparationSince our data comes from the government, it does not have too much outliers and noise. But we still need to do some transformation. See the table below:
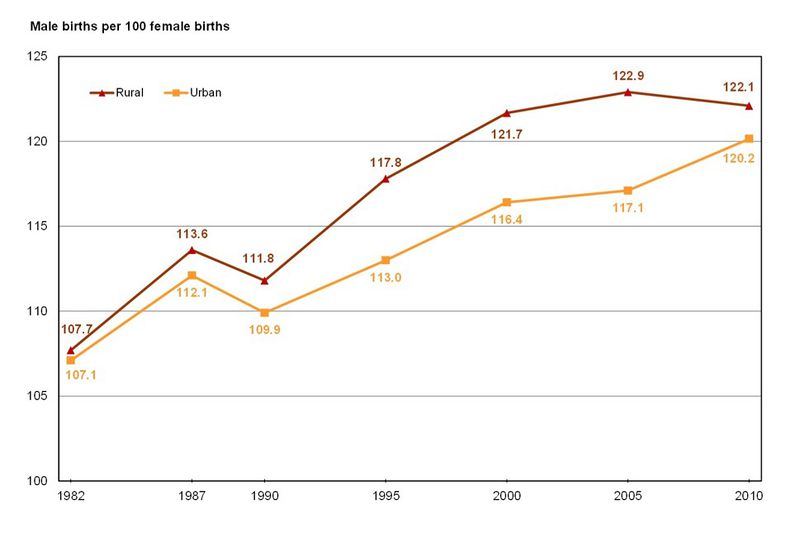
First we use the number of second child boys/second child girls to calculate the sex ratio at birth. And then we tried to calculate the proportion of education level of female by using the formula Agricultural population/Population. Finally, we calculated the Proportion of Second Child by using Second child/Number of New born. Data ExplorationAfter we load the data using R, we get the chart below: We can see that the number of Male births per 100 female births has been increasing since 1990s. we think that it’s because the Family planning policy took a serious effect after that time. Sine every family can only have one child, more and more Chinese choose to have a boy rather than a girl. |
Data Analysis
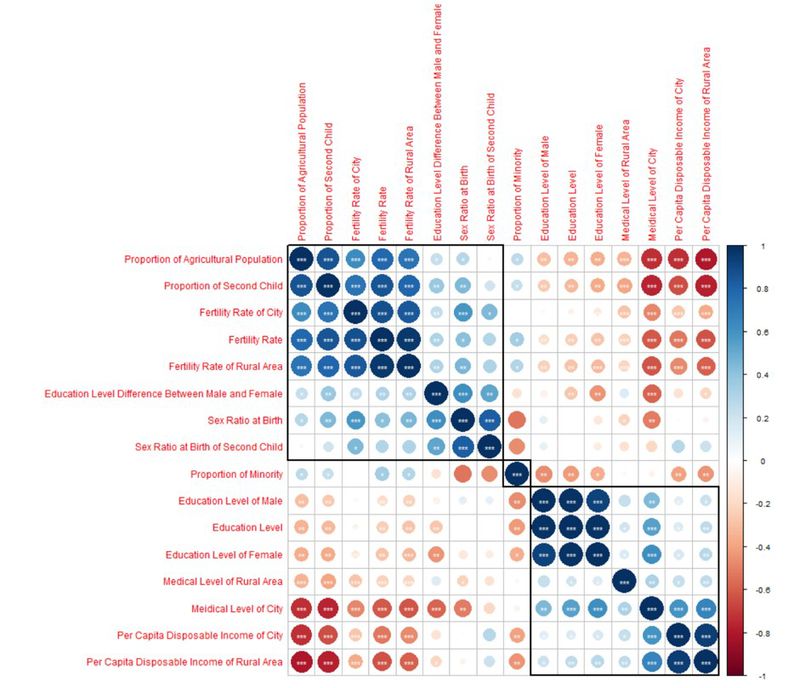
In this part we will be trying to make two different analyses to find out which variable is affecting the sex ratio at birth in China more seriously. Bivariate Relationship AnalysisWe tried to find the relationship between different variables and our target, it should be like the image below: The graph is a bivariate correlation matrix of all variable. The dark blue means the variables are positively correlated and the dark red represents that the variables are negatively correlated. And the number of stars in circle represents the level the variables correlated with each other. To be specific, the number of stars means the significant level is 99.9%, 99% and 95% successively. We find that: • The proportion of agricultural population is negatively correlated with the per capita disposal income and the number of medical beds provided for thousand people which represents the medical level. • The proportion of agricultural population is highly correlated with general fertility rate and the proportion of the second child. • The per capita disposal income is negatively correlated with the proportion of second child among all new born, the proportion of agricultural population and general fertility rate. • The per capita disposal income is positively correlated with the medical level.
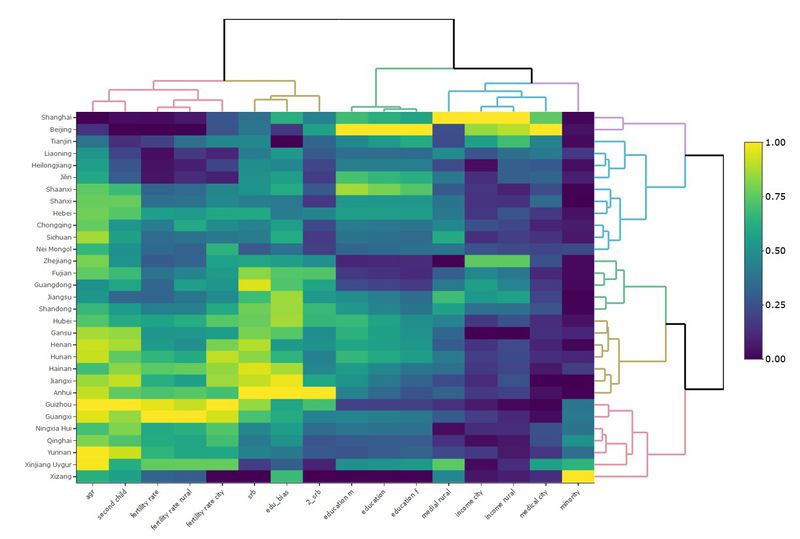
Heatmap Cluster AnalysisAnd then we tried to cluster the provinces of China based on the different factors. We get our heat map like that: So we divide the provinces into 5 groups:
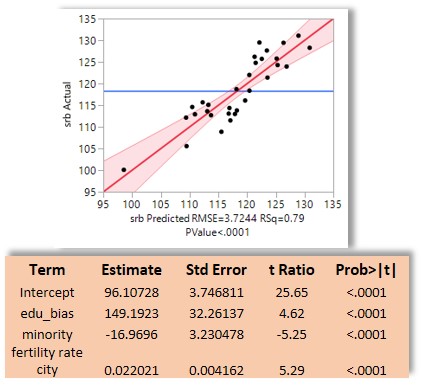
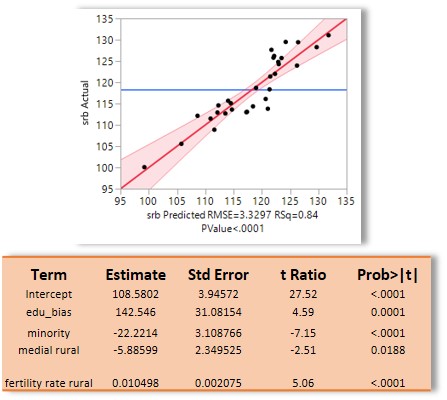
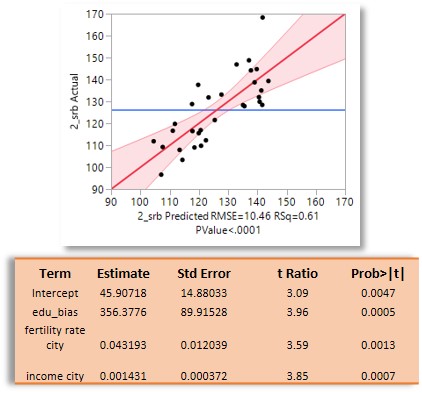
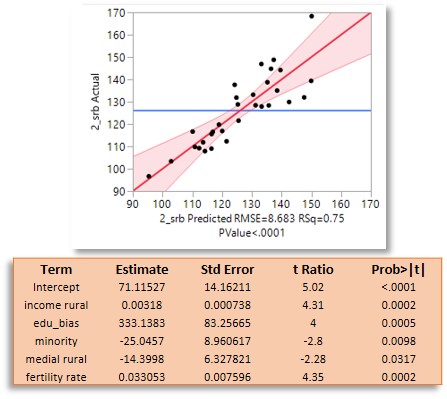
Multiple Linear Relationship ModelIn order to find out the most influential factors for sex ratio at birth in China, a model should be built to descript the situation. Since China is a huge country, geographic differences are wide and the spatial regression model is not suitable for the case. To determine the independent factors sex ratio at birth in China, multiple linear regression analysis was used. Base on real life situation and the observation for the dataset, there is a wide gap between rural and urban in China. Therefore, the data for cities and rural should be analysed separately. From analysis above, sex ratio at birth shows different with its parity, so the data for different parity can be analysed case by case. Then, stepwise regression analysis is used to select a best group of factors for the prediction of sex ratio at birth, and the multiple linear regression model is established. Finally, we get our result:
We can see that: For overall SRB (regardless of parity), the most influential factors are below: City: Education gap between male and female, Proportion of the population of ethnic minorities and Fertility rate Rural: Education gap between male and female, Proportion of the population of ethnic minorities, Medical facility and Fertility rate. For second child sex ratio at birth, the most influential factors are: City: Education gap between male and female, Disposable income and Fertility rate Rural: Disposable income, education bias, Proportion of the population of ethnic minorities, Medical facility and Fertility rate. |
Result
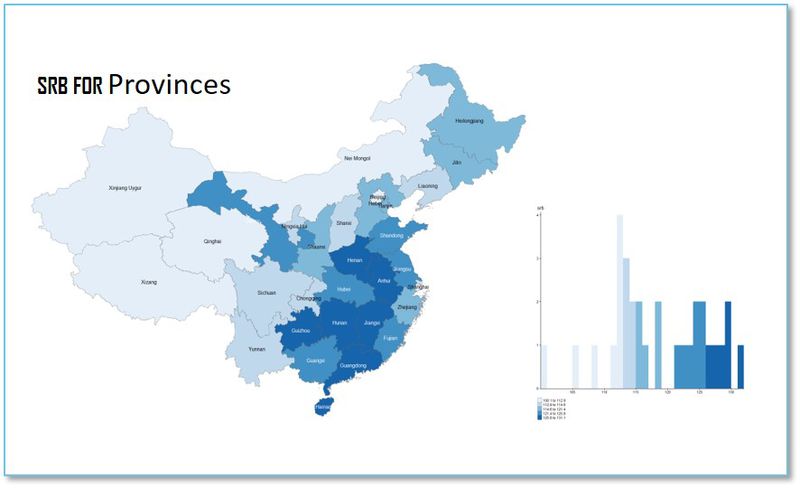
According to the SRB for each province, the range of SRB (100-131) can be divided into 5 parts. From the map it could be observed that most of the provinces which has highest SRB are inland province from south east of China. And provinces with low SRB are basically in the west border of China.
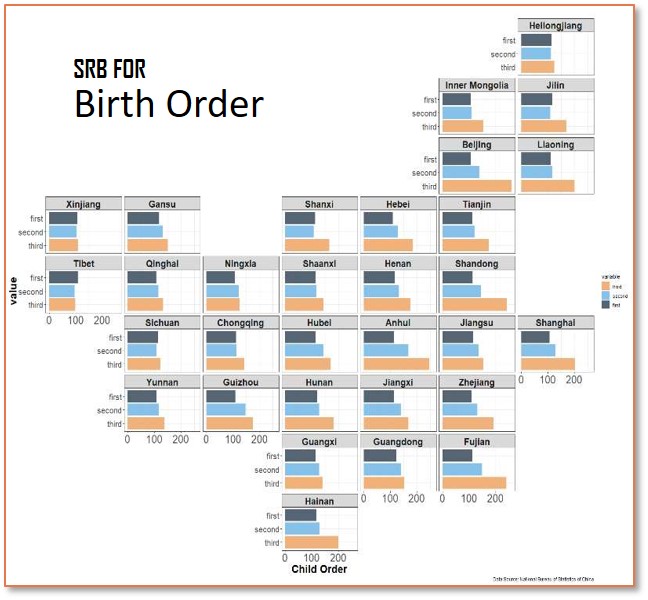
From birth order perspective, it can be observed that the SRB raised significantly with the birth order, in other words, people prefer to have son when they plan to have the second child or third child. The unusual SRB indicates that sex-specific abortion exists widely in most of the provinces. ConclusionChina has become the populous nation with highest sex ratio at birth, the SRB rise sharply with parity. Which means people still have strong preference of son in China. 1) The gap between city and rural is wide, the indicators for city and rural are distinct. The influential factors for SRB in rural and cities are different. 2) Proportion of the population of ethnic minorities is one of the significant factors in case of SRB in a specific area. The reason might be the one-child policy which make restrict ethnic majorities to have more than one child. Therefore, ethnic majorities in China more likely to have sex-specific abortion which leads to rise of SRB. 3) Education gap between male and female, these indicators shows the education equality of opportunity in the areas. The province with large gap between female and male in education means that female is more likely to suffer from gender discrimination, which could be a circumstantial evidence to reveal the reason why the area has high SRB. 4) Fertility rate, the SRB is effected by fertility rate. Women in high fertility rate area are tend to produce more sons. |
Future Work
It will be more precise to take geographic factors into consideration when analysis the population data, and the spatial related model such as spatial log model should be built to make further analysis. While the spatial model is not suitable for make analysis for huge area like China. For the future work, the separate province can be taking out for spatial analysis in small area, and find out more insights. The data set can expand to several years’ census data, and make a time series model which shows more strong evidence to the research and can be used for future SRB prediction. |
Acknowledgements
The authors wish to thank Dr. Kam Tin Seong, Associate Professor of Information Systems (Practice), at the School of Information Systems in Singapore Management University, for his patient mentorship and guidance in making this visualization project a resounding success. |
References
|
