Difference between revisions of "ISSS608 2018-19 T3 Assign PARAM GADHAIYA MethodologynDataprep"
Paramg.2017 (talk | contribs) |
Paramg.2017 (talk | contribs) |
||
| Line 57: | Line 57: | ||
</div> | </div> | ||
| − | = Creating the Geolocation | + | = Creating the Geolocation points: = |
<font size = 3;font-family: Arial> To find the X and the Y coordinates of every dumping ground in Boonsong Lekagul Waterways, the following steps were taken: </font> | <font size = 3;font-family: Arial> To find the X and the Y coordinates of every dumping ground in Boonsong Lekagul Waterways, the following steps were taken: </font> | ||
<font size = 3;font-family: Arial> <br> 1. Load the Boonsong Lekagul Waterways excel file onto Tableau. Under the maps options, select background images. | <font size = 3;font-family: Arial> <br> 1. Load the Boonsong Lekagul Waterways excel file onto Tableau. Under the maps options, select background images. | ||
| Line 67: | Line 67: | ||
<br> 3. Save the data sheet and left join the new data set to the existing dataset. | <br> 3. Save the data sheet and left join the new data set to the existing dataset. | ||
<br> [[Image:3(2).png|500px]] | <br> [[Image:3(2).png|500px]] | ||
| + | <br> 4. Click on new sheet and drag and drop X coordinate into columns and Y coordinates into rows. Add the background image and check the scale. The map of the dumping grounds appear as below: | ||
| + | <br> [[Image:4(2).png|500px]] | ||
Revision as of 02:26, 11 July 2018
|
|
|
|
|
The following datasets were used for creating the visualizations:
|
Datasets |
Description |
|
Boonsong Lekagul Waterways Readings |
The .xlsx file contains details about the sample id, location from where the sample is taken, date when the sample is taken, type of measure and value of measure. |
|
Chemical Units of Measure |
The .xlsx file contains the name of the measure and the unit of measurement |
|
Map of Waterways |
The .jpg file contains the map which comprises of the several dumping grounds in Boonsong Lekagul waterways |
Creating the Geolocation points:
To find the X and the Y coordinates of every dumping ground in Boonsong Lekagul Waterways, the following steps were taken:
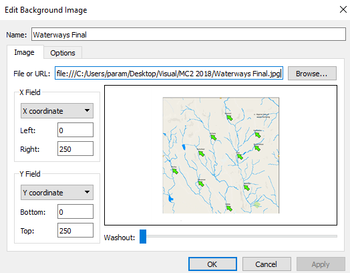
1. Load the Boonsong Lekagul Waterways excel file onto Tableau. Under the maps options, select background images.
Select add an image and input the name, file and X and Y field as shown below.

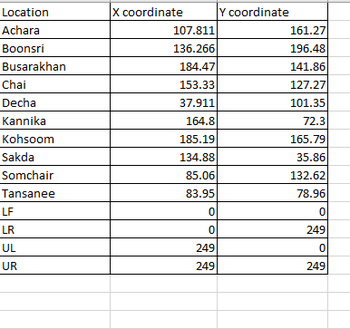
2. Based on the scale of the map, Select the exact point and click on annotate to insert and obtain the X and Y coordinates. Input the coordinates obtained on to a new excel file. The excel sheet now has the following values:

3. Save the data sheet and left join the new data set to the existing dataset.

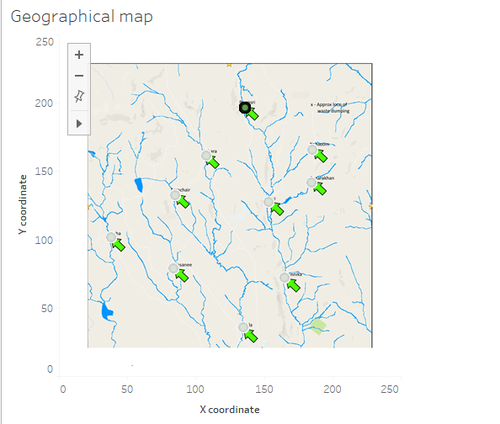
4. Click on new sheet and drag and drop X coordinate into columns and Y coordinates into rows. Add the background image and check the scale. The map of the dumping grounds appear as below:

