|
|
| Line 123: |
Line 123: |
| | </tr> | | </tr> |
| | <tr> | | <tr> |
| | + | </table> |
| | | | |
| | ==Anomalies in the dataset== | | ==Anomalies in the dataset== |
| Line 136: |
Line 137: |
| | </tr> | | </tr> |
| | <tr> | | <tr> |
| − | <td> <b>2. Rangers Trend </b> | + | <td> <b>2. Chlorodinine </b> |
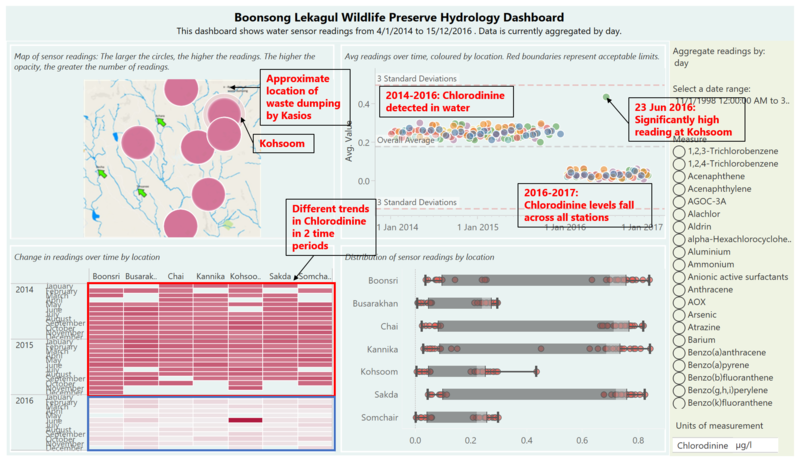
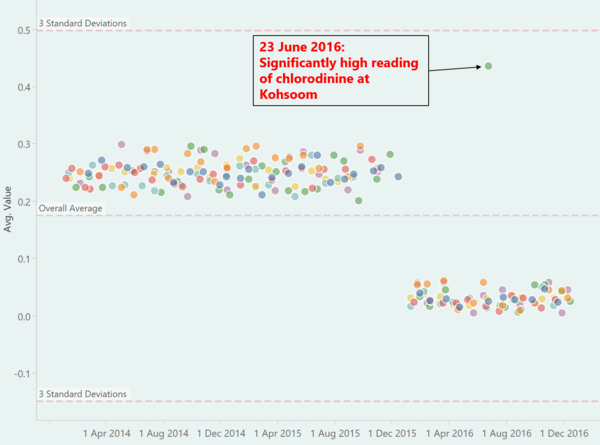
| − | <br>Fig 8 below reveals weekly activity pattern for rangers. In 8.1, the heatmap was configured to show the average stay duration for the rangers at various gates. We noticed the rangers would stay for extended durations at camping 8 (Mondays, 10am to 14pm) as well as gate 2 & rangerstop 1 (Mondays 6am – 11am, Wednesdays 13 – 16pm). The rangers could be doing inspection or maintenance works at this these locations. Looking at the reserve map, we can observe that ranger stop 1 and camping 8 are both located at the “dead ends” of the reserve, with no paths extending beyond them – it is likely that these two locations are surrounded with floras whereby periodic maintenance is required. | + | <br>On 23 June 2016, there is a abrupt spike in chlorodinine levels at Kohsoom even though chlorodinine levels are low across all other locations during that period. An industrial site near Kohsoom might have breached environmental regulations at the time, and could potentially be Kasios since Kohsoom is the closest station to the suspected waste dumping. |
| − | | + | </td> |
| − | <br>In Fig 8.2 we could see the rangers gathered at the rangerbase and gate 8 (which is in close proximity to the ranger base) on Thursdays 14pm. It could be an indication that the weekly ranger meetings were held on Thursdays 14pm at the rangerbase.</td>
| + | <td>[[File:Chlorodinine_Miko2.png|600px|center]]</td> |
| − | <td>[[File:gyf_updated9.png|600px|center]]</td> | |
| | </tr> | | </tr> |
| | <tr> | | <tr> |
Revision as of 22:23, 8 July 2018
 VAST Challenge 2018 MC2: Suspense at the Wildlife Preserve
Insights from Viz
Chemical Contamination: Trends of possible interest
| Insights |
Visualization |
| 1. Toxic manufacturing chemical - Methylosmolene
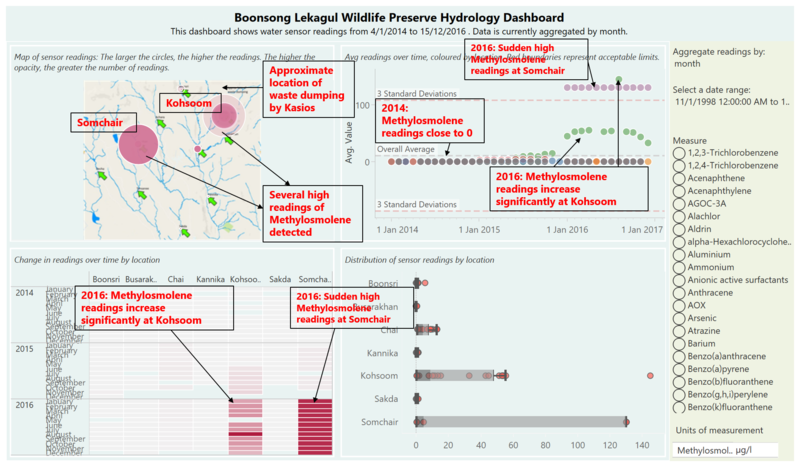
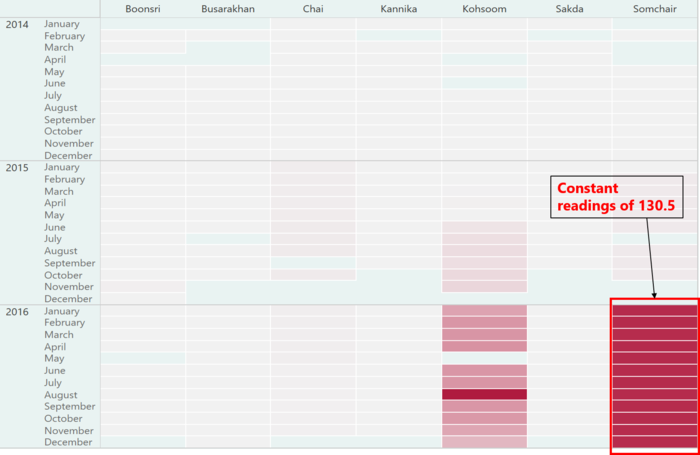
Sensor readings of Methylosmolene started from 2014, and only at the stations of Boonsri, Busarakhan, Chai, Kannika, Kohsoom, Sakda and Somchair. From 2014 to 2015, sensor readings of this toxic chemical was close to zero. However, in 2016, Methylosmolene readings at Somchair suddenly spiked to a very high, constant value of statistical significance (greater than 3 standard deviations from the mean. Readings also increased sharply at Kohsoom, which is the closest station to the approximate location of alleged waste dumping by Kasios.
Further investigation of these high Methylosmolene readings reveals that at Somchair, the high readings were constant at 130.5 ug/l throughout the year of 2016 without any change. It is possible that there could have been a problem with the sensor.
At Kohsoom, readings started increasing since the mid of 2015. There is one particularly high reading of Methylosmolene on 26 August 2016, which surpasses even the readings detected at Somchair.
|
|
| 2. Anionic Active Surfactant
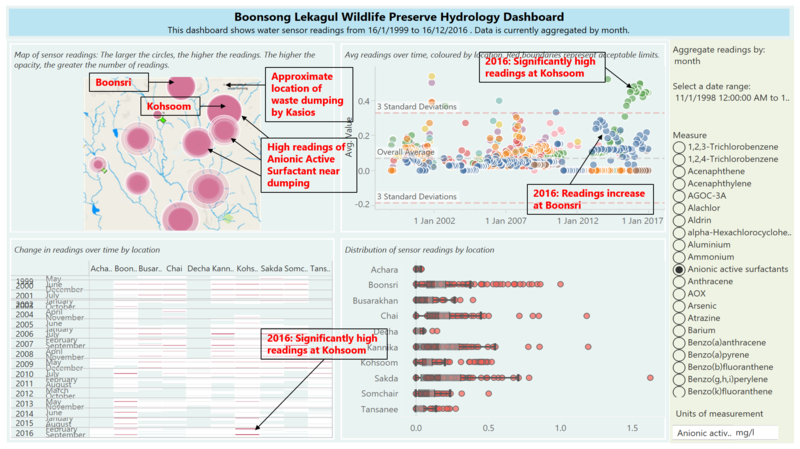
The station closest to the suspected waste dumping, Kohsoom, also detects significantly high readings of Anionic Active Surfactant in 2016. Readings also increased at Boonsri, which is relatively close to the dumping site as well.
|
|
| 3. Arsenic
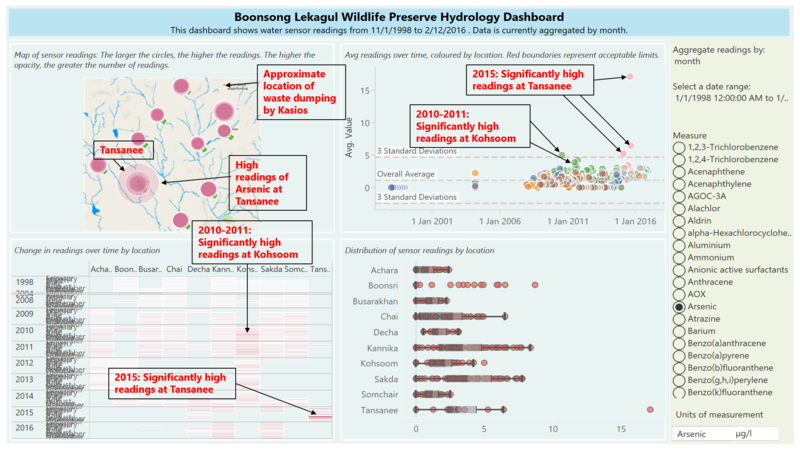
Arsenic is known to be a very toxic contaminant in soil. Stations started picking up readings of Arsenic since 2008. Levels of Arsenic stayed close to zero until 2010, where readings at Kohsoom saw a significant increase. In fact, on 26 August 2010, there was a statistically significant increase in Arsenic levels at Kohsoom. Levels remained high in 2011.
In recent times, spikes of Arsenic sensor readings were detected in Tansanee, in 2015. There was an extraordinary high reading of Arsenic at Tansanee on 13 August 2015 (17.15 ug/l). This is the highest level of Arsenic recorded in the history of the data, which is a genuine cause of concern.
|
|
| 4. Biochemical Oxygen Demand
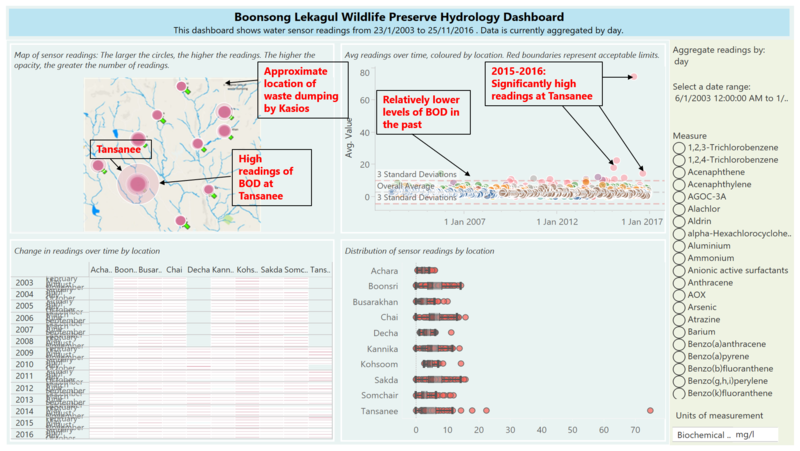
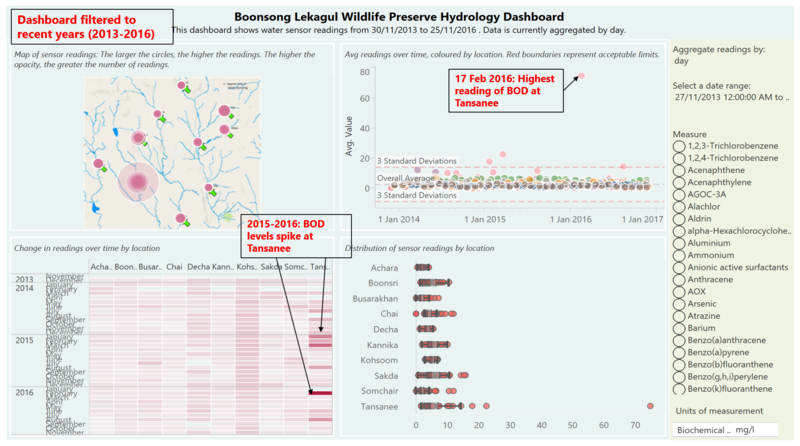
Another important indicator of water pollution is Biochemical Oxygen Demand (BOD). Rivers are considered severely polluted when levels of BOD exceed 8 mg/l. In 2015-2016, the Tansanee station has seen significant increase in BOD levels. There was an extraordinary high reading of BOD at Tansanee on 17 February 2016 (74.71 mg/l), which is of great concern as it almost 10 times above the limit mentioned earlier. The rivers at Tansanee in recent times is severely polluted.
The filtered dashboard show the spikes in BOD at Tansanee in recent times.
|
|
| 5. Chlorodinine
The previous VAST challenge identified chlorodinine as one of the toxic chemical contaminants produced by factories in the preserve. From 2014-2016, levels of chlorodinine were constant across all stations but then abruptly fell from 2016-2017. One possible reason for this sudden decline is the introduction of environmental regulations in the preserve. However, on 23 June 2016, there was a spike in chlorodinine readings at Kohsoom, the closest station to the location of waste dumping. It is possible that the waste dumping occurred that day and is worth an investigation.
|
|
| 6. Chromium
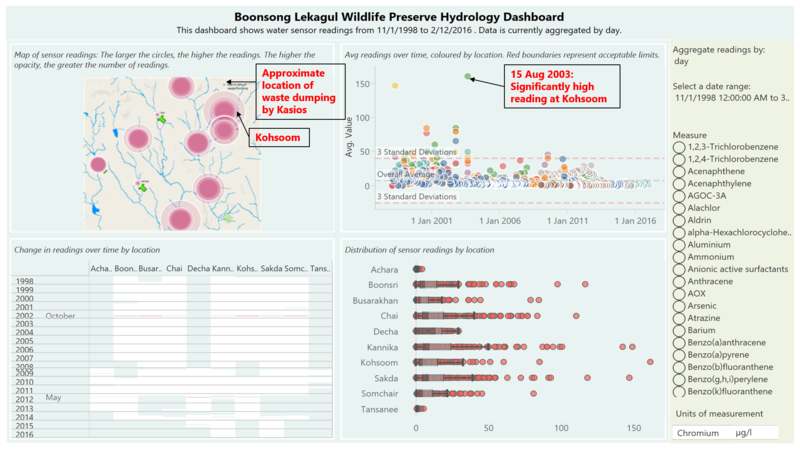
The manufacture of stainless steel and sewage sludge are sources of chromium contamination in soils. It is an environmental concern because excessive concentrations are toxic to living organisms. A significant reading of chromium was detected on 15 August 2003 at Kohsoom, the station closest to the site of waste dumping.
|
|
| 7. Cyanides
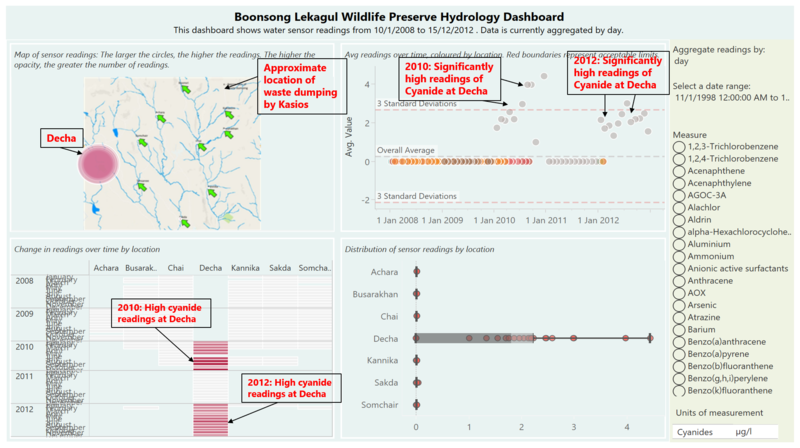
Cyanide is very toxic to living organisms and its removal from water is critical. While there has not been high levels of cyanide detected in areas close to the location of the waste dumping, significantly high readings of cyanide were detected in Decha, in 2010 and 2012. Investigations should be carried out in any industrial sites near the area as these sensor readings are a cause for concern.
|
|
| 8. Iron
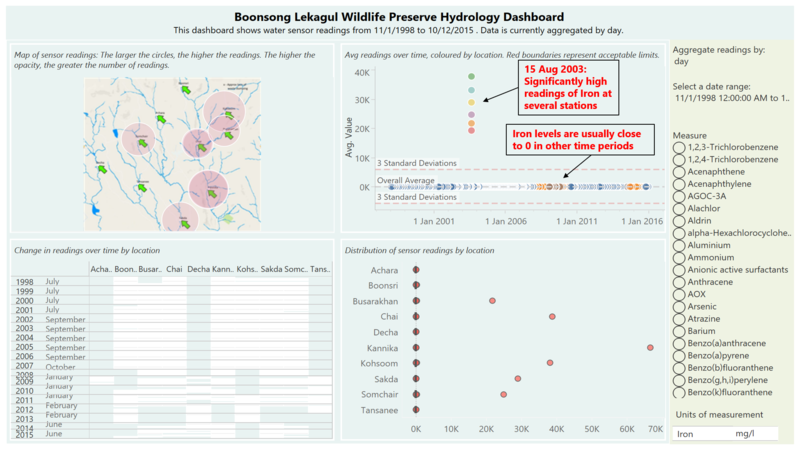
While iron is not known to be a key contaminant in soil, it is worth noting that on 15 August 2003, significantly high readings of iron were captured at several stations similar to chromium above. These anomalies are interesting because iron levels are close to zero during other time periods.
|
|
| 9. Lead
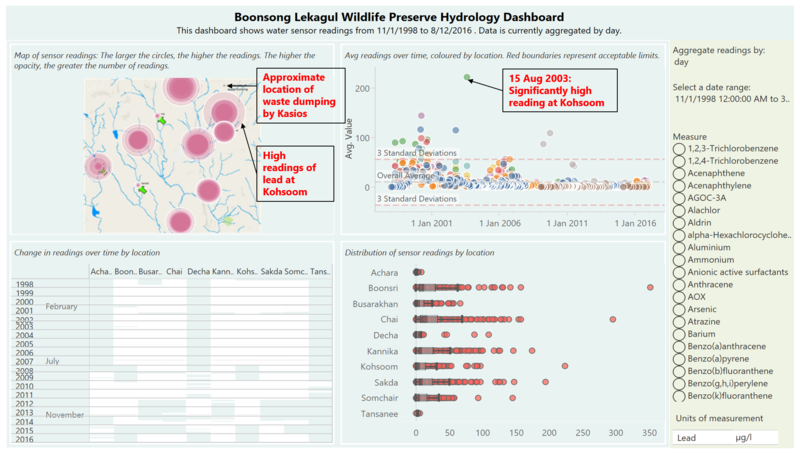
Sewage sludge is a source of lead contamination in soils. While lead readings are generally close to zero in recent times, there was a significantly high reading detected at Kohsoom on 15 August 2003, the same day during which especially high levels of chromium and iron were detected at several locations.
|
|
| 10. Nickel
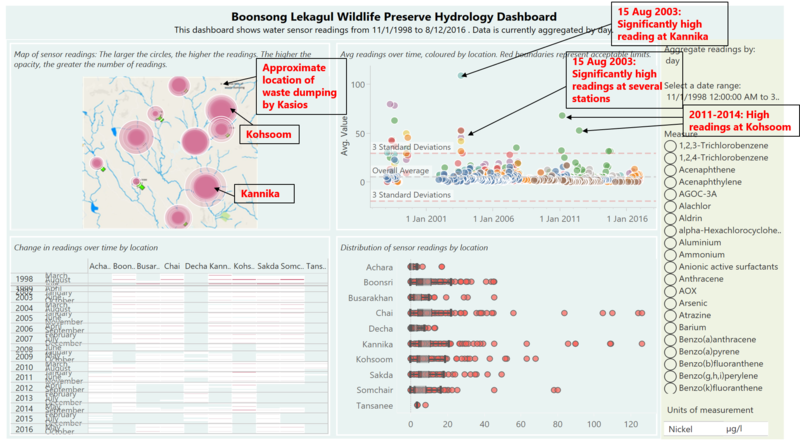
Nickel is also produced by industrial activities with sewage sludge a common source. At excessive concentrations, it is toxic to living organisms. On 15 August 2003, significantly high levels of nickel were detected across several stations: Kannika (the highest reading), Chai, Kohsoom, Somchair and Sakda. In 2011, 2012 and 2014, Kohsoom also saw high Nickel readings detected.
|
|
Anomalies in the dataset
What anomalies do you find in the waterway samples dataset? How do these affect your analysis of potential problems to the environment? Is the Hydrology Department collecting sufficient data to understand the comprehensive situation across the Preserve? What changes would you propose to make in the sampling approach to best understand the situation? Your submission for this question should contain no more than 6 images and 500 words.
| Insights |
Visualization |
|---|
1. Methylosmolene
There are anomalies found in the sensor readings for methylosmolene. In 2016, the Somchair station detects significantly high, constant readings of 130.5 ug/l. Since the values are the same throughout the year, these readings are most likely anomalies. The sensor could be having issues. |
|
| 2. Chlorodinine
On 23 June 2016, there is a abrupt spike in chlorodinine levels at Kohsoom even though chlorodinine levels are low across all other locations during that period. An industrial site near Kohsoom might have breached environmental regulations at the time, and could potentially be Kasios since Kohsoom is the closest station to the suspected waste dumping.
|
|
3.Service Trucks
Fig 9 below shows the weekly movement pattern for service trucks at various gates. We noticed that there were a higher number of service trucks moved pass the “connecting path” on Thursdays, at two prominent timings: 1am and 16pm. This might be the scheduled delivery/pick up hours for the service trucks. |
|
| 4. Sightseeing coaches
Lastly, Fig 10 shows the weekly movement pattern for sightseeing coaches. The sightseeing coaches seemed to be bringing the visitors to the reserve on fixed days and hours, as the darker blocks on the heatmap tend to appear in regular intervals. For example, the coaches tend to visit the reserve at below timings:
-Fridays & Sundays 3am
-Thursdays & Sundays 11am
-Sundays 16pm
-Mondays 22 pm |
|
The Anomalies
The Movement Anomaly
We first used the “Movement Anomaly” dashboard to discover the anomalies in the visitors’ movements. Each individual movement was represented by a Gantt bar. The Y axis contains all the days in the observation period and X axis shows the hours of the day. Filters allows the users to filter to see the activities at restricted gates, or only the activities by certain type of cars or visitors. Three movement anomalies were observed.
| Anomalies & Car ID |
Visualization |
| In 12.1, we filtered away the 2P cars and filtered in only the restricted gates and noticed two types of trespassing behaviours:
a.A group of 6 cars (type 1) entered from entrance 1 trespassing restricted area ranger stop 1 from 10am to 16pm, on 10 July 2015. The sensors at gate2 did not capture any of their activities, most likely they moved to rangerstop1 from the entrance1 directly through the jungles. As discussed earlier on, rangerstop 1 is one of the areas that are frequently maintained by the rangers and floras could be found there. This could be one area where the birds are nesting.
|
The gif below shows the paths adopted by the suspicious vehicles,the restricted gates are colored in red. |
| 2.b.4 vehicle entered from entrance 3 trespassing restricted areas (gate5,gate6,rangerstop6,gate3 & ranger stop 3) 23 times from 2am to 5 am, only observed on Tuesdays and Thursdays. The trespassing cars followed almost exactly the same paths. This looks like some planned acts which were only performed under the masks of the dark night. Type 4 vehicles are the heavy trucks; they could be transporting some illegal materials in or out of the preserve repeatedly.
|
The gif below shows the paths adopted by the suspicious vehicles,the restricted gates are colored in red. |
| In 12.2, we kept only the “extended campers” and included all the gates in the analysis. We noticed some suspicious movements of the extended campers at 0 hours which the rest of the extended campers would not be active at this hour. Interestingly, we noticed all the activity records belong to the car ID 20154519024544-322, which stayed in the preserve for 5 months. |
Stay Duration Anomaly
In the “Stay Duration Anomaly” dashboard we introduced two scatter plots for anomaly discovery.
| Anomalies & Car ID |
Visualization |
| 4.Abnormally high number of stops visited with low average duration
• Car-ID 20154519024544-322 visited total 281 stops in the park and stayed in the park from 19th Jun to 5th Oct (Extended camper). The same car ID appeared under observation 4.
• Car-ID 20154112014114-381 visited 98 stops and stayed from 14th Jun to 26th Jul (Extended camper)
5.Abnormally high average duration in the reserve with low number of stops visited
• 20150105060134-242, 20150420100416-232 visited 4 checkpoints but stayed for over one month in the reserve (Extended camper) |
|
| 6.Hiking or sightseeing visitors with abnormally long stay in the park (they are the same group of visitors observed in 1)
7.Hiking or sightseeing visitors with abnormally long stay in the park, car type4
|
|

