Difference between revisions of "ISSS608 2017-18 T3 Assign Lu Yanzhang Insights"
| Line 74: | Line 74: | ||
[[File:Q3_gephi.png|600px|center]] | [[File:Q3_gephi.png|600px|center]] | ||
| − | Does the group composition change during the course of their activities? | + | |
| − | How do the group’s interactions change over time? | + | <b> 3.1 & 3.2 Does the group composition change during the course of their activities? How do the group’s interactions change over time? |
| + | </b> | ||
| + | <b> Dynamic social network Interpretation: </b> | ||
| + | |||
| + | |||
[[File:Q3 gephi.gif|600px|center]] | [[File:Q3 gephi.gif|600px|center]] | ||
Revision as of 21:31, 8 July 2018
|
|
|
|
|
Question 1 :Using the four large Kasios International data sets, combine the different sources to create a single picture of the company. Characterize changes in the company over time. According to the company’s communications and purchase habits, is the company growing?
Growing pattern Interpretation:
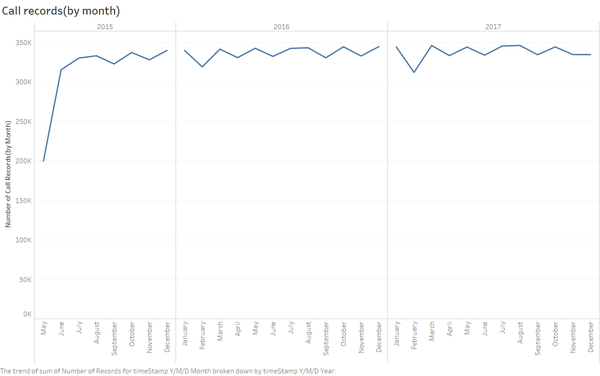
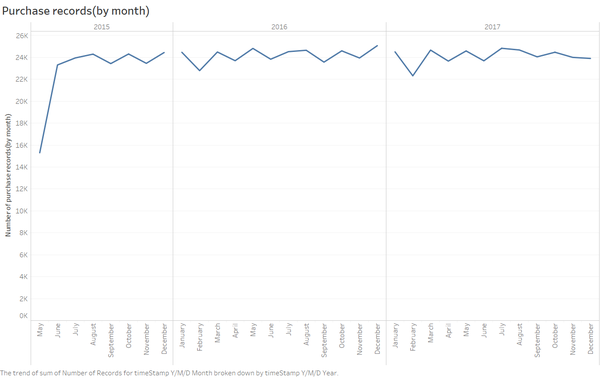
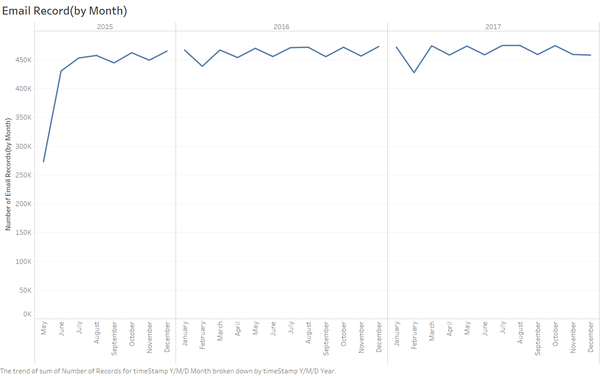
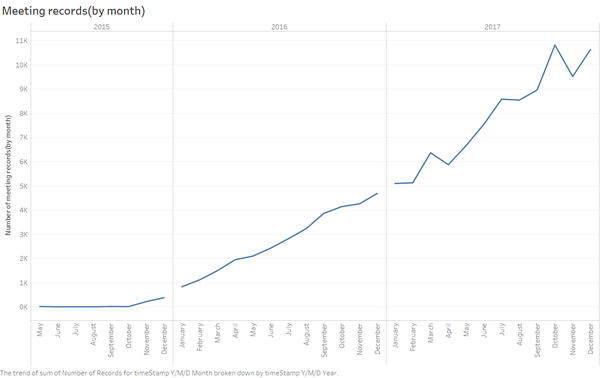
In terms of Meeting, Purchase, Call, Email record from May 2015 to December 2017, four graphs below indicate the trend of the number of records separately.
From Purchase, Call and Email record perspectives, starting in May 2015, the number of records increased rapidly in the next two months (July 2017). After this, the number of records of the three aspects almost keep dynamically stable trends.
From the meeting records, the number has kept a growth trend since October 2015. Before this, the number of meeting almost is 0.
Conclusion:
In a sum, the company grows rapidly from May 2015 to July 2015. After this, in general, the company keeps a dynamically stable trend in the communications and purchase records.
Question 2 :Combine the four data sources for group that the insider has identified as being suspicious and locate the group in the larger dataset. Determine if anyone else appears to be closely associated with this group. Highlight which employees are making suspicious purchases, according to the insider’s data.
Suspicious staffs interpretation:
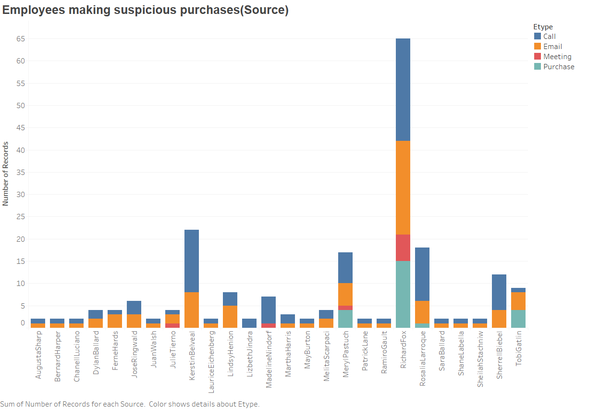
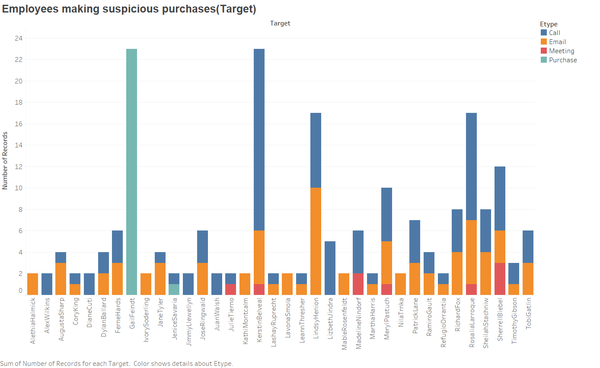
After filtering out the all excels given by the competition, the two figures below indicate what I have found. For the source figure, it indicates the 26 people are the event organizer involved in the suspicious activities including Call, Email, Meeting, and Purchase. Clearly, the figure RichardFox is the most active staff involving the suspicious events and the sum number of all events is 65. Similarly, the other figure, the employee making suspicious events, indicates the suspicious staffs. It turns out GaiFeindt and KerstinBelveal are the two staff who deserves the highest effort to observe.
Question 3 :Using the combined group of suspected bad actors you created in question 2, show the interactions within the group over time. Limit your responses to 10 images and 1000 words
3.1 Characterize the group’s organizational structure and show a full picture of communications within the group. Social network Interpretation:
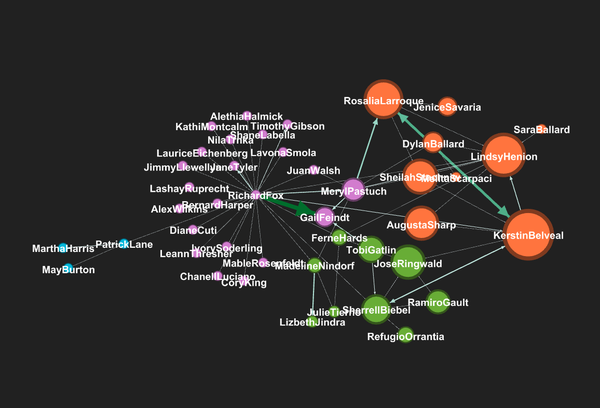
After applying relevant social network analytics methodologies (eigenvalue centrality and Modularity) to the suspicious source and target staffs, the social network figure below indicates some key insights:
 1.The directed graph compromise of 43 vertexes and 76 edge, which denotes 43 relevant staffs and 76 suspicious event logs.
 2. The same color represents the same working function in the corporate. In other words, it is highly likely that they
    work for an individual function in the company. Thus, there might have 4 functions involved in this auspicious event.
 3. The size of the nodes denotes the importance of the staff and the bigger the size is, the more critical the staff is.
    Take an instance, the size of the orange group is clearly bigger than other groups, which means the whole orange function works in a more important role.
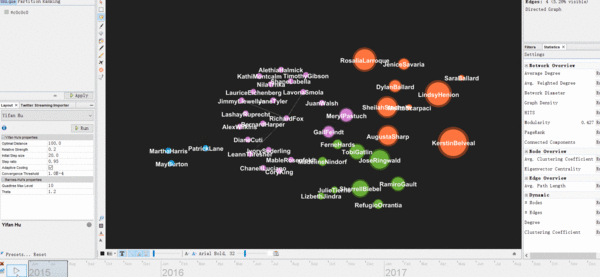
3.1 & 3.2 Does the group composition change during the course of their activities? How do the group’s interactions change over time?
Dynamic social network Interpretation:
