Difference between revisions of "ISSS608 2017-18 T3 Assign Jyoti Bukkapatil Observations & Insights"
| Line 119: | Line 119: | ||
'''Interaction Within The Suspicious Group:''' | '''Interaction Within The Suspicious Group:''' | ||
| − | Figure | + | |
| + | *Note that Node colors and Edge colors for this questions are fixed and are same as used in Question 2. Throughout this analysis, I have not changed the color aesthetic of the graph to keep nodes linked to their department/group in the company as per findings in Question2 Figure 1. | ||
| + | Figure 1 below shows the network graph for the combined group of suspicious employees and their suspicious interactions.size of the node represents the degree centrality of the node. The graph shows Degree centrality of each node along with its Lable. | ||
| + | |||
| + | [[Image:ISSS608 2018 Jyoti Bukkapatil Q3 1.png|600px|center|border]] | ||
| + | <center style="font-size:13px;"> <u>Figure 1</u> </center> | ||
| + | |||
| + | *Max number of members belong to group number 3 in an organization which was found in Quetion2 Figure1. This is also a relatively small group in an organization. | ||
| + | *Richard Fox with highest degree centrality had maximum suspicious interactions during last two and half year. Which makes him the Most important person in the course of suspicious activities and group. | ||
| + | *Followed by Richard, Lindsy Henion, Tobi Gatlin & Meryl Postuch had a large number of interactions which makes them second most important members of this group. | ||
| + | |||
| + | '''Interactions over the time period''' | ||
| + | To study Interactions between these suspicious employee group over the last two and half year, I divided time quarterly and below are findings for every quarter of the year. | ||
| + | |||
| + | *Figure 2 show network graph for interactions took place in the Year 2015 Q4.This might be a start of Suspicious activities as in 2015Q4, the maximum number of suspicious group members were involved in interactions. Same can be seen from Figure 2. Richard Fox being in the center of communications with many members has the highest degree centrality. He has initiated 8 (out-degree )conversations and received 3 (In Degree) . Members of all 6 groups were involved in the conversation. | ||
| + | [[File:ISSS608 2018 Jyoti Bukkapatil Q3 1.png|600px|center|border]] | ||
| + | <center style="font-size:13px;"> <u>Figure 2</u> </center> | ||
Revision as of 20:48, 8 July 2018
Contents
Question 01
Using the four large Kasios International data sets, combine the different sources to create a single picture of the company. Characterize changes in the company over time. According to the company’s communications and purchase habits, is the company growing? Limit your responses to 5 images and 500 words.
Analysis through visualization
Please note that data for Q3 Year 2015 was excluded to for better visualization of the trend.
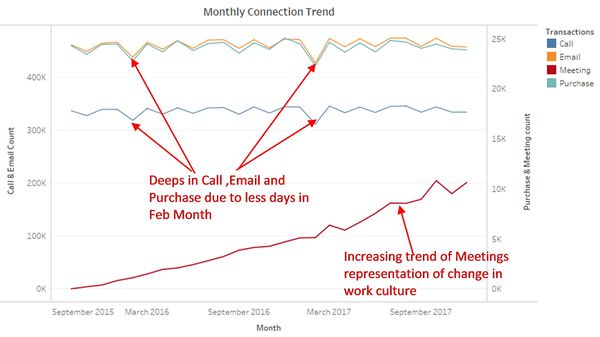
- Time Series plot in figure 1 shows the monthly pattern for Calls, Emails, Purchases, and Meetings. The overall trend for Calls, Emails, and Purchases is stable throughout the past two years. This indicates that Kasios International is the stable company. There is neither a significant growth or decay.
- From figure 1 Call, Emails and Purchases are highly correlated and follow the same trend. Monthly Ups and down in calls, emails, and purchases follow the number of days in months. Deeps can be observed for months with 30 days and ups can be observed for months with 31 days. Similarly, two major deeps are for Feb 2016 and Feb 2017 respectively.
- The continuous increasing trend of Meetings might be due to a change in work culture or some new initiatives.
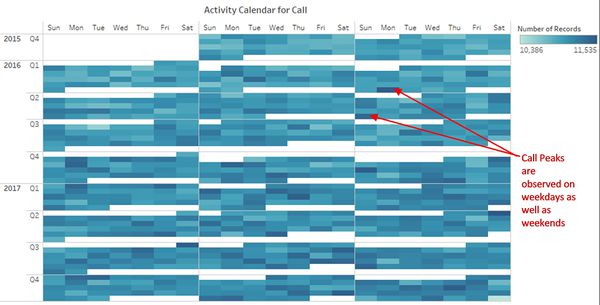
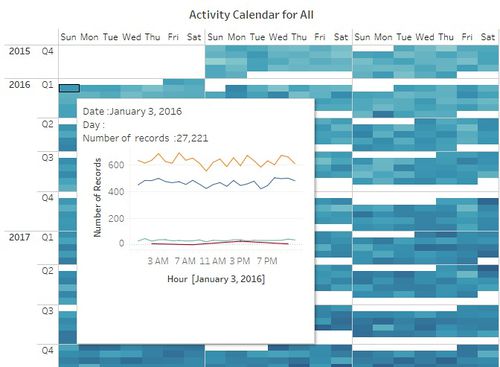
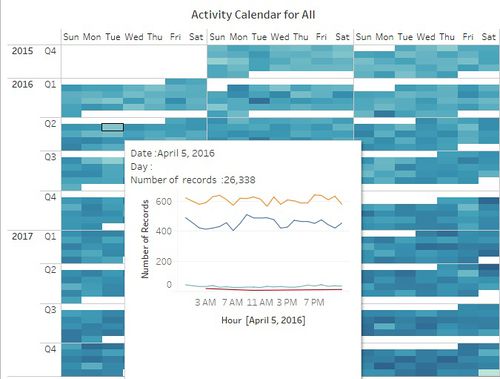
- Calendar view of daily calls (figure 2) shows that calls are randomly distributed throughout the week. There is no fixed pattern for the number of calls. There are peaks on weekdays as well as weekends. This might be because this is an international company and employees were working with people around the world from different time zones.
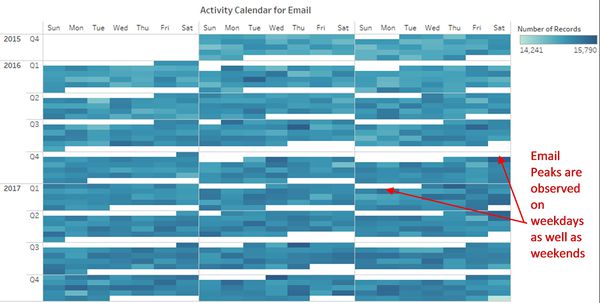
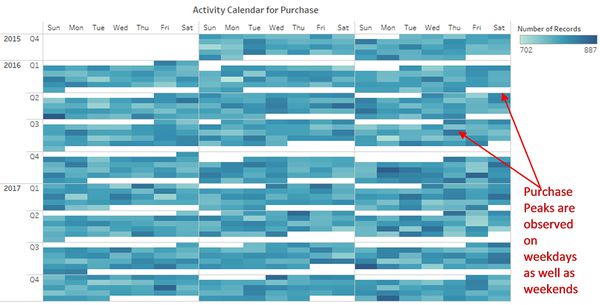
- Figure 3 & 4 shows Calendar plot for Email and Purchases. The daily pattern for a number of emails and Purchases is randomly distributed throughout the week which is the same as calls pattern.
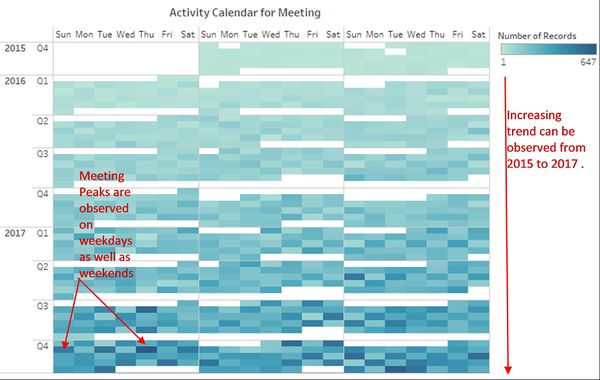
- Calender plot for a daily pattern of the number of meetings is shown in Figure 5. The number of meetings has increased towards the end of 2017 Dec. Surprisingly the number of meetings also are randomly distributed throughout the week. In a month there is no fixed pattern of meetings like weekly or biweekly. Like other communications and purchases, the high number of meetings also can be observed on weekdays as well as the weekend.
- Figure 6 & 7 shows hourly time series pattern for calls, emails, purchases, and meetings for weekday and weekend both. For both weekday and weekend calls, emails and Purchases are initiated throughout 24 hours, which indicates that employees might be working in shifts to coordinate with all time zone areas. However, meetings timings are restricted between 3 am to 11 pm for weekends and 3 am to 12 am on weekdays.
Question 02
Combine the four data sources for a group that the insider has identified as being suspicious and locate the group in the larger dataset. Determine if anyone else appears to be closely associated with this group. Highlight which employees are making suspicious purchases, according to the insider’s data. Limit your responses to 8 images and 500 words.
Analysis Through Visualisation
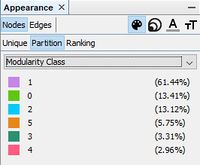
- List of 20 employees has been given by insider from Kasios International along with details of suspicious interactions including calls, emails, meeting, and purchases. Figure 1 shows how these 20 employees are associated with groups/departments within the company. Nodes are grouped & colored together based on Modularity class (Community detection algorithm).
These suspicious 20 employees are associated with 6 different groups/departments in the company.
- Richard Fox, Tobi Gatlin, Maryl Pastuch and Lizbeth Jindra were associated with four different groups and were highest degree centrality (connectivity) member of respective groups. Which indicates that these four might be in lead /managerial positions.
- Out of remaining 16 members, 4 are connected associated to one group (Modularity class 5) and 12 are associated with one group (Modularity Class 3)
<<interactive link>>
- By filtering nodes based on Betweenness centrality, other employees which are closely associated with suspicious employees were found. Betweenness centrality measures the extent to which a vertex lies on paths between other vertices. Vertices with high betweenness may have considerable influence within a network by their control over information passing between others. They are also the ones whose removal from the network will most disrupt communications between other vertices because they lie on the largest number of paths taken by messages.
- Figure 2 shows 14 such members which will have an impact on communication between suspicious employees. The nodes of smaller size represent these 14 members. There is a high chance that information being shared among suspicious employees passes via these members and hence they might be associated with suspicious employees.
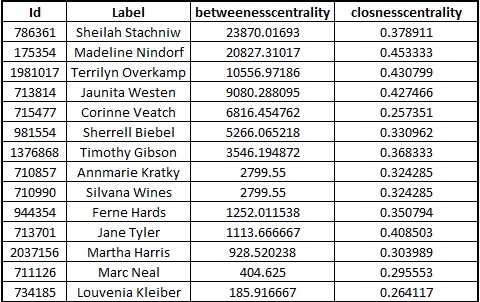
- Below table lists name of these 14 employees along with their Betweenness centrality and Closeness Centrality measures. However, these employee list is filtered based on betweenness centrality only.
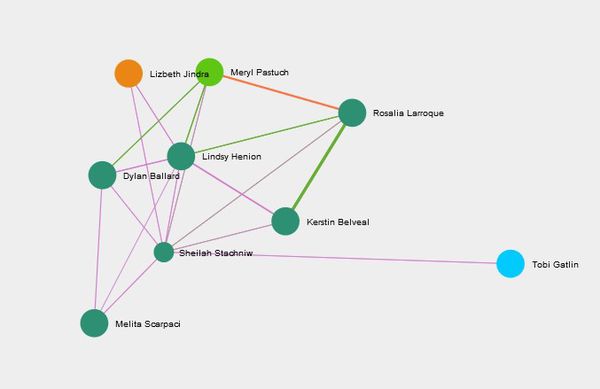
- Sheilah Stachniw has the highest betweenness among 14 employees. Sheilah Stachniw has interacted with 7 of suspicious employees and is the only point of connection for Tobi Gatlin to connect with other 6 suspicious group of employees. All interactions between Tobi and other Six employees must be going through Sheilah so there are high chances that Sheilah is closely associated with suspicious employees. Figure 3 shows the network graph for Sheilah Stachniw.
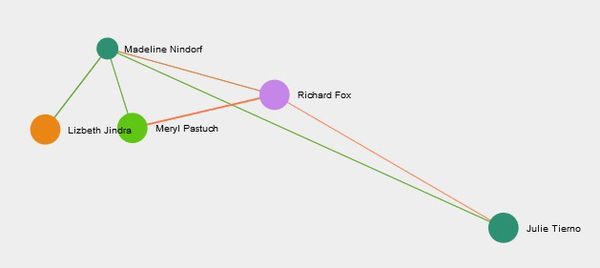
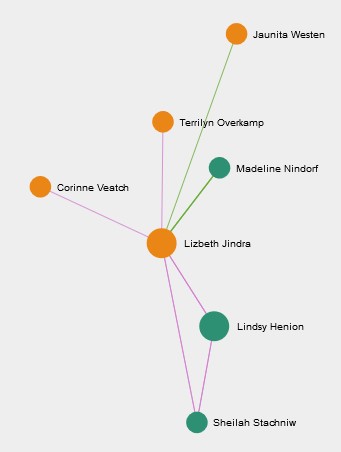
- Madeline Nindorf with second highest betweenness centrality among 14 employees can highly impact communication between suspicious employees. Madeline also has the highest closeness centrality measure. Figure 4 shows the network graph for Madeline. Madeline is an intermittent point for Lezbeth Jindra to share information with three suspicious members.
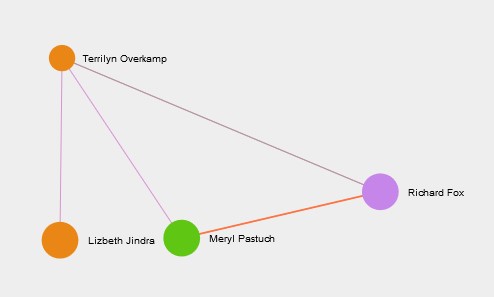
- Terrilyn Overkamp the third person who can impact communication between suspicious employees. Figure 5 shows the network graph of Terrilyn, who is the connecting point for Lezbeth Jindra to communicate with Meryl Pastuch and Richard Fox.
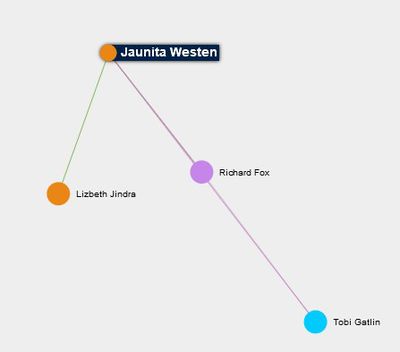
- Juanita Westen is a mediator between Lezbeth Jindra and Richard Fox, who is one of the most important people with high degree centrality. Juanita has 4th highest betweenness centrality measure among those 14 associated employees.
- Rather, Lizabeth Jindra is only connected with Lindsy Henion from the group of suspicious employees. Rest of his connections are this 5 employees from the list of 14 employees which were found to be closely associated with suspicious employees. So we can say that these five employees may be most likely associated with Suspicious employees and their activities.
- Employees making suspicious purchases:
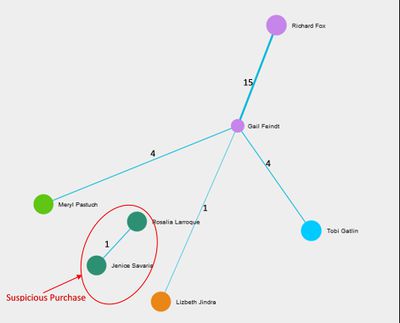
Figure 8 shows the network graph for Purchases made by suspicious employees. There were total 25 purchase transactions took place and all these purchase orders were addressed to Gail Feindt. We can clearly see only one purchase transaction looks offbeat and it’s from Rosalia Larroque to Jenice Savaria. An insider has mentioned this transaction between Rosalia and Jenice in his data.
Question 03
Using the combined group of suspected bad actors you created in question 2, show the interactions within the group over time. Limit your responses to 10 images and 1000 words Characterize the group’s organizational structure and show a full picture of communications within the group. Does the group composition change during the course of their activities? How do the group’s interactions change over time?
Interaction Within The Suspicious Group:
- Note that Node colors and Edge colors for this questions are fixed and are same as used in Question 2. Throughout this analysis, I have not changed the color aesthetic of the graph to keep nodes linked to their department/group in the company as per findings in Question2 Figure 1.
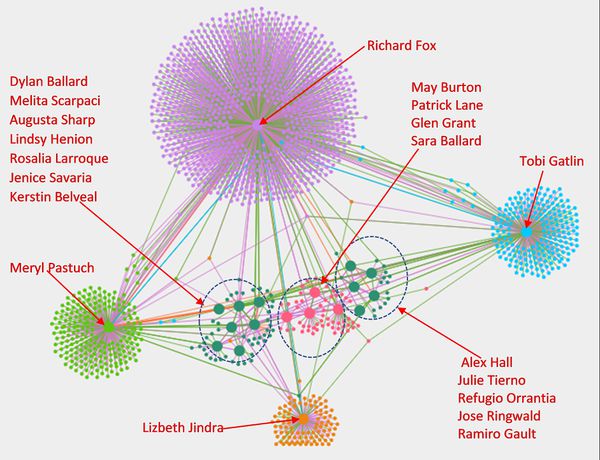
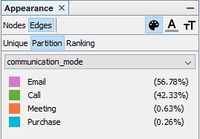
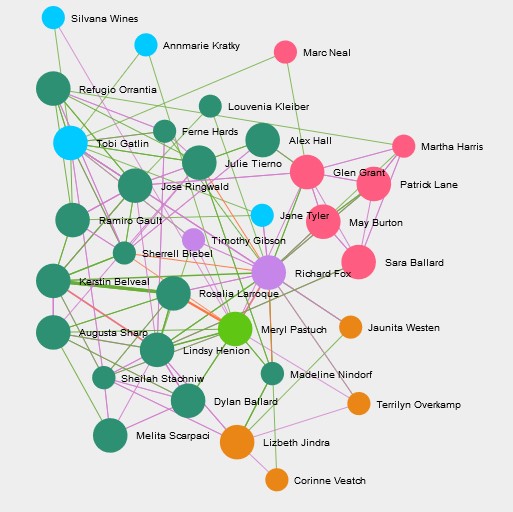
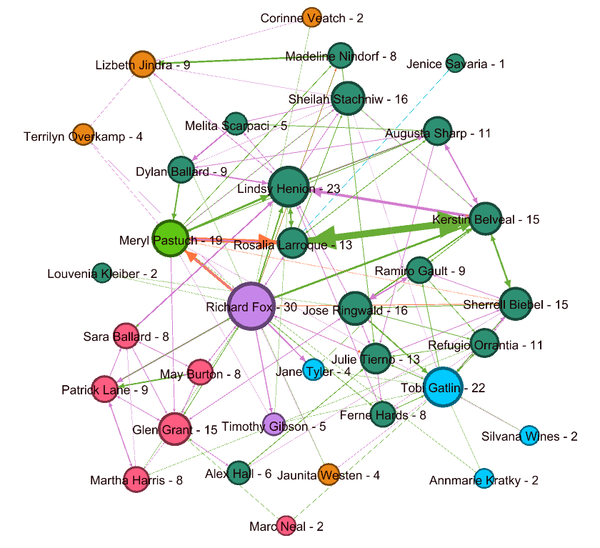
Figure 1 below shows the network graph for the combined group of suspicious employees and their suspicious interactions.size of the node represents the degree centrality of the node. The graph shows Degree centrality of each node along with its Lable.
- Max number of members belong to group number 3 in an organization which was found in Quetion2 Figure1. This is also a relatively small group in an organization.
- Richard Fox with highest degree centrality had maximum suspicious interactions during last two and half year. Which makes him the Most important person in the course of suspicious activities and group.
- Followed by Richard, Lindsy Henion, Tobi Gatlin & Meryl Postuch had a large number of interactions which makes them second most important members of this group.
Interactions over the time period To study Interactions between these suspicious employee group over the last two and half year, I divided time quarterly and below are findings for every quarter of the year.
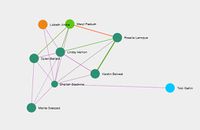
- Figure 2 show network graph for interactions took place in the Year 2015 Q4.This might be a start of Suspicious activities as in 2015Q4, the maximum number of suspicious group members were involved in interactions. Same can be seen from Figure 2. Richard Fox being in the center of communications with many members has the highest degree centrality. He has initiated 8 (out-degree )conversations and received 3 (In Degree) . Members of all 6 groups were involved in the conversation.
