Difference between revisions of "Observations"
Rupinis.2017 (talk | contribs) |
Rupinis.2017 (talk | contribs) |
||
| Line 65: | Line 65: | ||
[[Image:Rup chl.jpg|700px]] | [[Image:Rup chl.jpg|700px]] | ||
| + | |||
| + | ==<font size="5"><font color="#000000">'''Anomalies in the waterway samples'''</font></font>== | ||
Revision as of 19:05, 8 July 2018
|
|
|
|
|
|
|
Chemical Trend Analysis
1. Inconsistent Data Collection
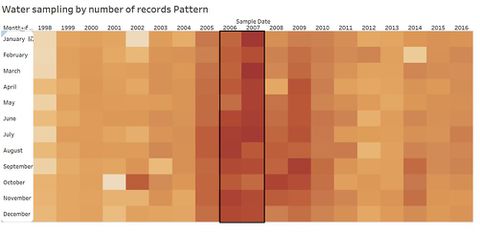
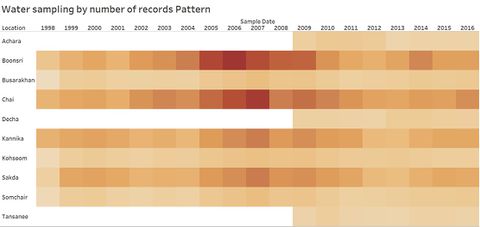
The data is collected from 1998 – 2016 in various locations of the preserve. However, it is noted that readings of many chemical indicators were not collected for the early years. Also, reading from sensors in Achara, Decha, Tansasee were collected only after 2009. There is an inconsistent data collection pattern observed as the number of records in 2006 (August and November) and 2007 (January and March) is higher compared to other years. It is found that number of records collected in Boonsri and Chai resulted in 2006 and 2007 contributed to the overall increase in the records.
2. Cyclic Pattern
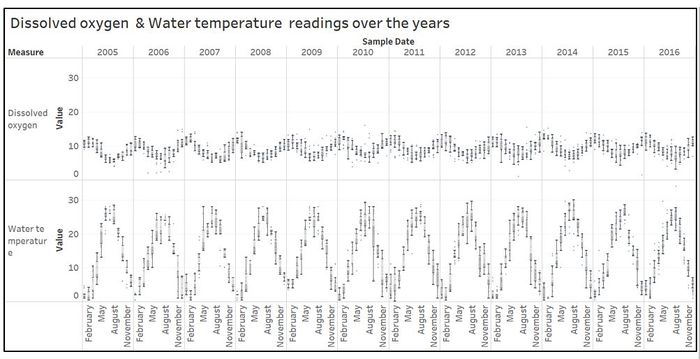
The water temperature and total dissolved O2 shows cyclic pattern over the years. It is also found that they both share a negative relationship; trend shows that increase in water temperature decrease total dissolved O2 value for the given period. The water temperature shows downward trend from October to March whereas total dissolved oxygen shows upward trend during the same time period. April to September is the period when there is increase in water temperature and is seen as an upward trend in the graph.
3. Sudden drop in total hardness
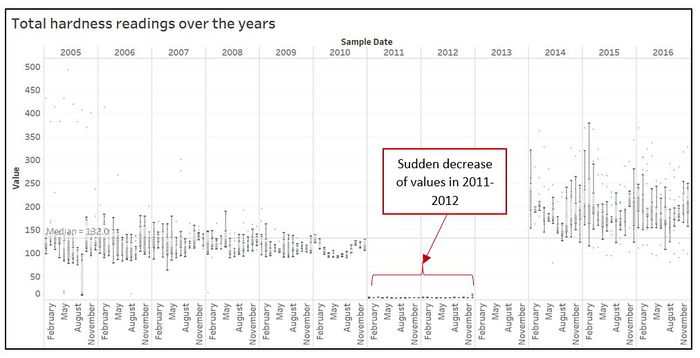
The total hardness reading is collected from 2005. The median value from 2005 to 2016 is 139 mg / l. However, it is found that the hardness value dropped below 5 mg / l in 2011 and this pattern continued in 2012 as well. There is no data collected for the year 2013. There is an increasing trend from year 2014 to 2016 where readings are higher compared to previous 6 years records.
4. Increase in Anionic Active Surfactant
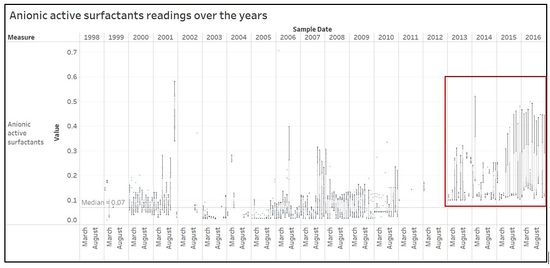
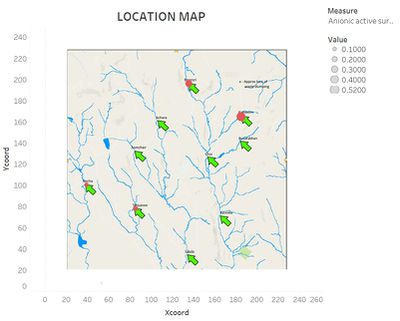
Anionic active surfactant is generally used in cleaning products. The readings of anionic active surfactant are collected from 1999 from various sensors in the preserve. The number of reading collected for this chemical indicator is found to be very low in 1999, 2002, 2011, and 2012 compared to other sampling years. It is found that the value of anionic active surfactant has increased from the year 2013 to 2016. Boonsri and Kohsoom are found to have higher values of Anionic active surfactant from 2013 until 2016. As shown in the map, Kohsoom is identified as one location for waste dumping in the previous studies.
5. Decrease in Chlorodinine in 2016
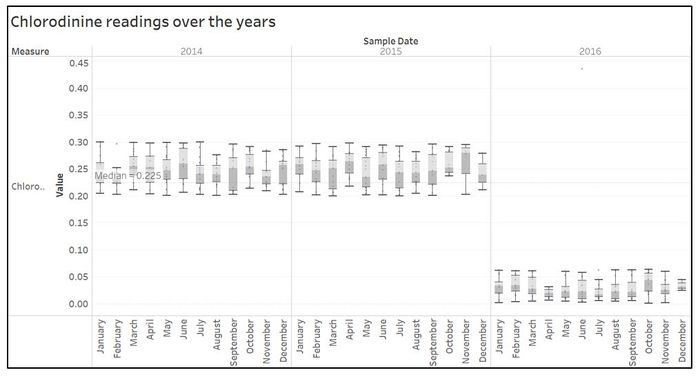
Readings for Chlorodinine is collected by various sensors only for last 3 years (2014 – 2016). Compared to readings in 2014 and 2015, there is clear decreasing trend observed in all readings for 12 months period in 2016. The median reading in 2016 is found to be 0.025 μg / L compared to 0.246 μg / L in 2014 and 0.252 μg / L in 2015.
