Difference between revisions of "ISSS608 2017-18 T3 Assign Sun Shuangtian Data Selection"
Jump to navigation
Jump to search
Stsun.2017 (talk | contribs) |
Stsun.2017 (talk | contribs) |
||
| Line 25: | Line 25: | ||
; | ; | ||
[[ISSS608_2017-18_T3_Assign_Sun_Shuangtian_Conclusion | <font color="#FFFFFF"> Conclusion </font>]] | [[ISSS608_2017-18_T3_Assign_Sun_Shuangtian_Conclusion | <font color="#FFFFFF"> Conclusion </font>]] | ||
| + | |||
| + | | style="font-family:Century Gothic; font-size:100%; solid #1B338F; background:#2B3856; text-align:center;" width="16.67%" | | ||
| + | ; | ||
| + | [[Assignment Dropbox G1| <font color="#FFFFFF"> Back to Dropbox1 </font>]] | ||
| style="font-family:Century Gothic; font-size:100%; solid #1B338F; background:#2B3856; text-align:center;" width="16.67%" | | | style="font-family:Century Gothic; font-size:100%; solid #1B338F; background:#2B3856; text-align:center;" width="16.67%" | | ||
| Line 32: | Line 36: | ||
|} | |} | ||
<br/> | <br/> | ||
| + | |||
Revision as of 20:42, 8 July 2018
 VAST 2018 Mini Challenge 1
|
|
|
|
|
|
|
|
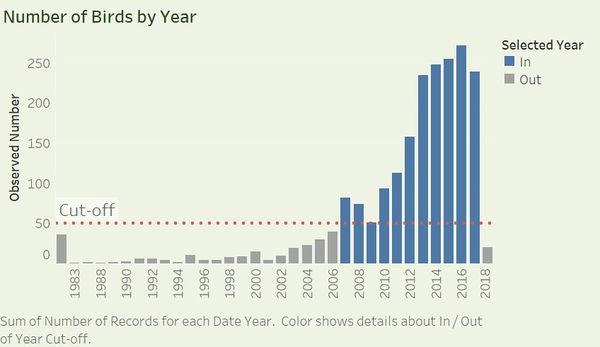
Select By Year
The number of records in the early years and year of 2018 are too few to detect pattern. Therefore, we set a cut off value of 60 records per year and select only records from year 2007 to year 2017 and analyze the migration pattern of all species over the years.

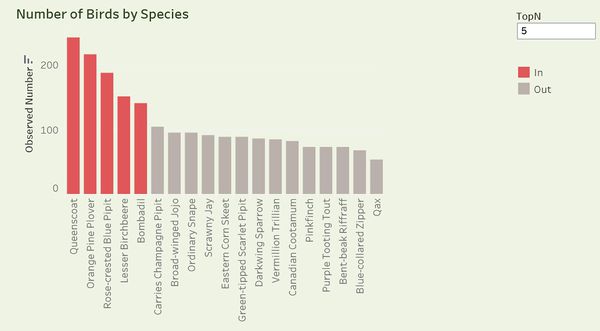
Select By Species
The number of birds observed for some species are too few to detect patterns, therefore, we allow the users to set the number of top species they want to observe. In our investigation, we select top 5 species to detect the migration patterns. (For users who expect to view more species, change the number of N in Tableau dashboard.)
