Difference between revisions of "Methodology"
Rupinis.2017 (talk | contribs) (Undo revision 7174 by Yanzhang.lu.2017 (talk)) |
|||
| Line 1: | Line 1: | ||
<div style=background:#2B3856 border:#A3BFB1> | <div style=background:#2B3856 border:#A3BFB1> | ||
| − | [[Image: | + | [[Image:Duck.jpg|250px]] |
| − | <font size = | + | <font size = 5; color="#FFFFFF"> Vast Mini Challenge 2: Like a Duck to Water</font> |
</div> | </div> | ||
<!--MAIN HEADER --> | <!--MAIN HEADER --> | ||
| Line 7: | Line 7: | ||
| style="font-family:Century Gothic; font-size:100%; solid #000000; background:#2B3856; text-align:center;" width="20%" | | | style="font-family:Century Gothic; font-size:100%; solid #000000; background:#2B3856; text-align:center;" width="20%" | | ||
; | ; | ||
| − | [[ | + | [[OVERVIEW| <font color="#FFFFFF">'''Overview'''</font>]] |
| style="font-family:Century Gothic; font-size:100%; solid #1B338F; background:#2B3856; text-align:center;" width="20%" | | | style="font-family:Century Gothic; font-size:100%; solid #1B338F; background:#2B3856; text-align:center;" width="20%" | | ||
; | ; | ||
| − | |||
| − | | style="font-family:Century Gothic; font-size:100%; solid #1B338F; background:#2B3856; text-align:center;" width="20%"| | + | [[Methodology| <font color="#FFFFFF">'''Methodology'''</font>]] |
| + | |||
| + | | style="font-family:Century Gothic; font-size:100%; solid #1B338F; background:#2B3856; text-align:center;" width="20%" | | ||
; | ; | ||
| − | [[ | + | |
| + | [[Observations| <font color="#FFFFFF">'''Observations'''</font>]] | ||
| style="font-family:Century Gothic; font-size:100%; solid #1B338F; background:#2B3856; text-align:center;" width="20%" | | | style="font-family:Century Gothic; font-size:100%; solid #1B338F; background:#2B3856; text-align:center;" width="20%" | | ||
; | ; | ||
| − | [[ | + | [[Conclusion| <font color="#FFFFFF">'''Conclusion'''</font>]] |
| − | | style="font-family:Century Gothic; font-size:100%; solid #1B338F; background:# | + | | style="font-family:Century Gothic; font-size:100%; solid #1B338F; background:#2B3856; text-align:center;" width="20%" | |
| + | ; | ||
| + | [[Assignment_Dropbox_G1| <font color="#FFFFFF">'''Back to Dropbox'''</font>]] | ||
| + | | style="font-family:Century Gothic; font-size:100%; solid #1B338F; background:#2B3856; text-align:center;" width="20%" | | ||
| + | ; | ||
| + | | | ||
| + | | | ||
| + | |} | ||
| + | <br/> | ||
| + | |||
| + | <!--METHODOLOGY CONTENT --> | ||
| + | ==<font size="5"><font color="#000000">'''Overview'''</font></font>== | ||
| + | |||
| + | Two datasets are provided to answer the questions for this challenge; one is “Boonsong Lekagul waterways readings” and other is “Chemical units of measure”. The former file includes information related to 106 chemical indicators of water quality and their readings collected from 10 locations across the preserve. There are total of 136,824 records of readings collected from January 1998 to December 2016. Belos is the snippet of dataset. | ||
| + | |||
| + | [[Image:Rup Data.jpg|600px]] | ||
| + | |||
| + | |||
| + | ==<font size="5"><font color="#000000">'''Data Preparation'''</font></font>== | ||
| + | The above mentioned two data files are combined into one by matching measure name in both the files. Description of variables from the combined files is shown below. | ||
| + | |||
| + | [[Image:Variables.JPG|600px]] | ||
| − | |||
| − | |||
| − | |||
| − | + | ==<font size="5"><font color="#000000">'''Data Cleaning'''</font></font>== | |
| − | + | Initial data exploration of combined data files is performed in JMP. It is found that 9700 records of various chemical indicators have value of 0. Reading value of 0 is equivalent to missing value for any chemical measure. This can be problem if 0 is not removed from records and taken into tableau for visualization. Tableau treats 0 as value and plot these points in the visualization. To avoid that, records with value 0 is removed from dataset before loading into Tableau. | |
| − | |||
| − | |||
| − | + | [[Image:Data Cleaning.jpg|600px]] | |
| − | [[ | ||
| − | |||
| − | |||
| − | |||
| − | |||
| − | < | + | ==<font size="5"><font color="#000000">'''Geo – Location Mapping'''</font></font>== |
| + | In addition to two data files, an image file “Waterways Final” with location of various water sensors across the preserve is also provided. This image file is added to tableau workspace as a background image to extract the coordinates of every location of sensors. New excel file is created as “Location.csv” with column names as location, X and Y. The point that represents each location of sensors in the map is annotated to get X and Y coordinates. The values of coordinates are then manually included into the excel file. | ||
Revision as of 18:09, 8 July 2018
|
|
|
|
|
|
|
Overview
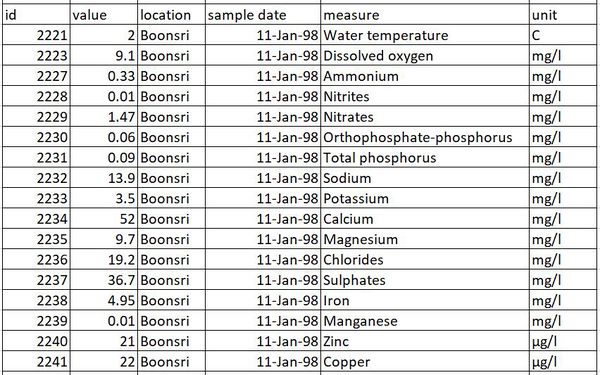
Two datasets are provided to answer the questions for this challenge; one is “Boonsong Lekagul waterways readings” and other is “Chemical units of measure”. The former file includes information related to 106 chemical indicators of water quality and their readings collected from 10 locations across the preserve. There are total of 136,824 records of readings collected from January 1998 to December 2016. Belos is the snippet of dataset.
Data Preparation
The above mentioned two data files are combined into one by matching measure name in both the files. Description of variables from the combined files is shown below.
Data Cleaning
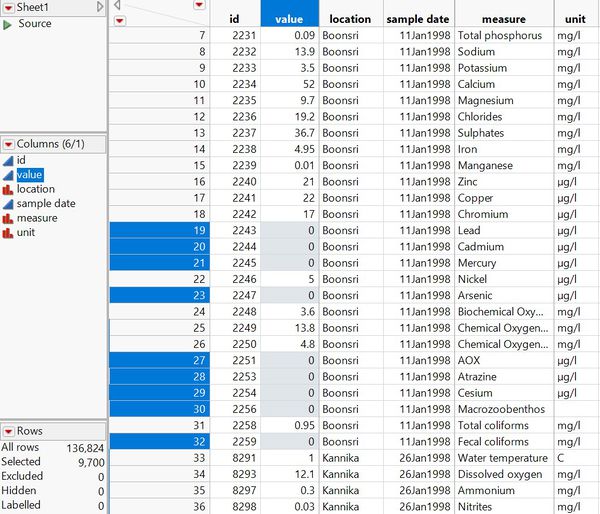
Initial data exploration of combined data files is performed in JMP. It is found that 9700 records of various chemical indicators have value of 0. Reading value of 0 is equivalent to missing value for any chemical measure. This can be problem if 0 is not removed from records and taken into tableau for visualization. Tableau treats 0 as value and plot these points in the visualization. To avoid that, records with value 0 is removed from dataset before loading into Tableau.
Geo – Location Mapping
In addition to two data files, an image file “Waterways Final” with location of various water sensors across the preserve is also provided. This image file is added to tableau workspace as a background image to extract the coordinates of every location of sensors. New excel file is created as “Location.csv” with column names as location, X and Y. The point that represents each location of sensors in the map is annotated to get X and Y coordinates. The values of coordinates are then manually included into the excel file.


