Difference between revisions of "ISSS608 2017-18-T3-Lokesh-Insights"
Lokeshv.2017 (talk | contribs) |
Lokeshv.2017 (talk | contribs) |
||
| Line 45: | Line 45: | ||
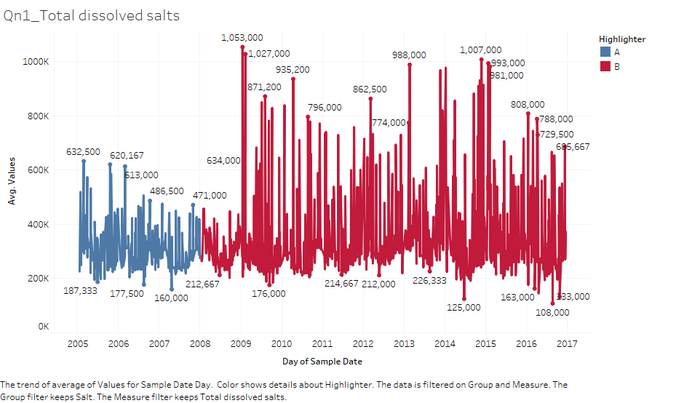
* From the recorded measurements of total dissolved salts from 2005 till 2016, the past readings, from 2005 – 2007, had values on an average less than the readings of the most recent year’s average. The highest ever recording a total dissolved salt was on January 2009 of 1 g/l, while even the values are fluctuating, the maximum average value has always been more than 500 mg/l from 2009-2016. | * From the recorded measurements of total dissolved salts from 2005 till 2016, the past readings, from 2005 – 2007, had values on an average less than the readings of the most recent year’s average. The highest ever recording a total dissolved salt was on January 2009 of 1 g/l, while even the values are fluctuating, the maximum average value has always been more than 500 mg/l from 2009-2016. | ||
* While closely looking at the minimum values of the average total dissolved salts in the water, over the recent years has always followed a cyclicity trend between 176 mg/l to 300 mg/l in the mid-quarter (June, July, August and September) of every year. | * While closely looking at the minimum values of the average total dissolved salts in the water, over the recent years has always followed a cyclicity trend between 176 mg/l to 300 mg/l in the mid-quarter (June, July, August and September) of every year. | ||
| − | [[File:1 12.1.png| | + | [[File:1 12.1.png|700px|centre]]<br/> |
===<font size = 3>Location analysis</font>=== | ===<font size = 3>Location analysis</font>=== | ||
* In the past, the mean average values for the total dissolved salts were higher to Busarakhan with a mean value of 444 mg/l followed by Somchair with 443 mg/l, while the least in the past year was at Boonsri with 245 mg/l. when comparing the past with the most recent years data, the Tansanee has the highest of all recording 733 mg/l of total dissolved salts in the waterway. | * In the past, the mean average values for the total dissolved salts were higher to Busarakhan with a mean value of 444 mg/l followed by Somchair with 443 mg/l, while the least in the past year was at Boonsri with 245 mg/l. when comparing the past with the most recent years data, the Tansanee has the highest of all recording 733 mg/l of total dissolved salts in the waterway. | ||
| − | [[File:2 12.2.png| | + | [[File:2 12.2.png|700px|centre]]<br/> |
==<font size = 3.5>2. Dissolved Oxygen:</font>== | ==<font size = 3.5>2. Dissolved Oxygen:</font>== | ||
| Line 54: | Line 54: | ||
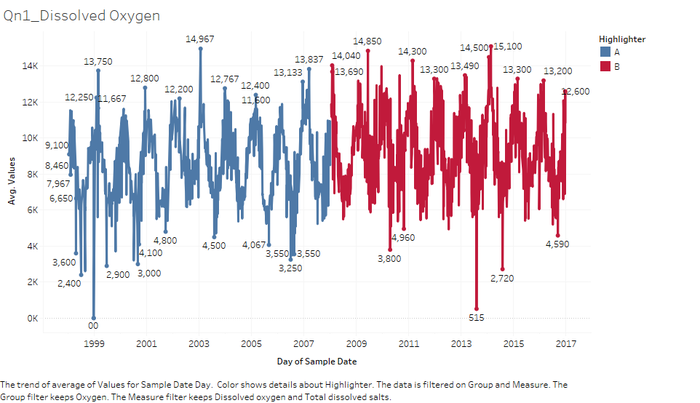
* Ever since the start of recording the measurement across the Mistford, the Dissolved oxygen has always been with the perfect cycle. Since the start, every mid-quarter of the year the value has dropped to the lowest in that year and then it again shoots up to the maximum of the year at the starting quarter (January – February - March). This cycle has been repeated all around the years. | * Ever since the start of recording the measurement across the Mistford, the Dissolved oxygen has always been with the perfect cycle. Since the start, every mid-quarter of the year the value has dropped to the lowest in that year and then it again shoots up to the maximum of the year at the starting quarter (January – February - March). This cycle has been repeated all around the years. | ||
* The lowest dissolved oxygen value ever record was on December 1998 where the value reached 0 mg/l, while the maximum over recorded dissolved oxygen value was on July 2010, at a massive 15.9 mg/l. | * The lowest dissolved oxygen value ever record was on December 1998 where the value reached 0 mg/l, while the maximum over recorded dissolved oxygen value was on July 2010, at a massive 15.9 mg/l. | ||
| − | [[File:3 12.3.png| | + | [[File:3 12.3.png|700px|centre]]<br/> |
===<font size = 3>Location analysis</font>=== | ===<font size = 3>Location analysis</font>=== | ||
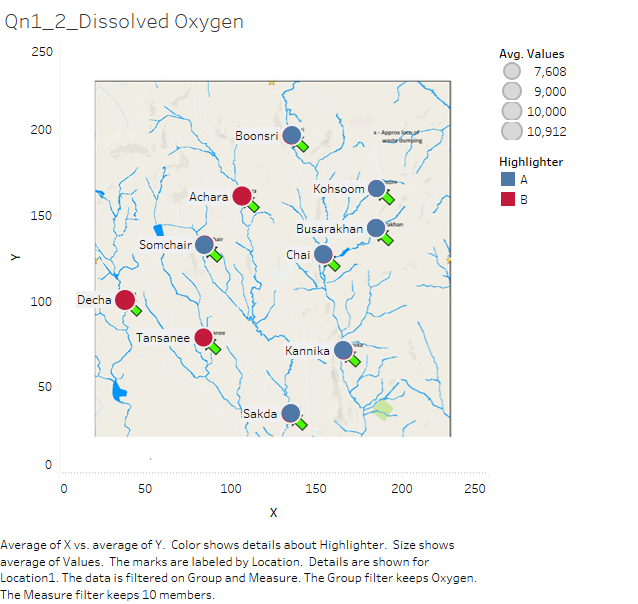
* Over the past years record, Chai has recorded the highest mean average value of dissolved oxygen of 8.6 mg/l. The right side of the map of Mistford was completely dominant in the past records while the left of the median in the map was more dominant in the most recent years. In the recent years, the Decha has recorded the highest ever average dissolved oxygen of 10 mg/l. | * Over the past years record, Chai has recorded the highest mean average value of dissolved oxygen of 8.6 mg/l. The right side of the map of Mistford was completely dominant in the past records while the left of the median in the map was more dominant in the most recent years. In the recent years, the Decha has recorded the highest ever average dissolved oxygen of 10 mg/l. | ||
| − | [[File:4 12.4.png| | + | [[File:4 12.4.png|700px|centre]]<br/> |
==<font size = 3.5>3. Total Phosphorus:</font>== | ==<font size = 3.5>3. Total Phosphorus:</font>== | ||
| Line 63: | Line 63: | ||
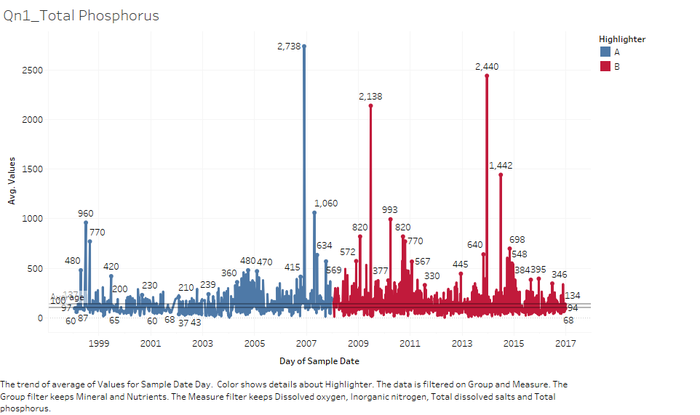
* Phosphorus is very important for any plant to grow healthier and the optimum level of phosphorous is essential to be present in the water, but if the limit of phosphorus exceeds the permissible limit, then it directly reduces the dissolved oxygen present in the water. The permissible limit of phosphorus in a river stream should be less than 100 μg/l, but the Mistford data gives us the mean of average phosphorous recorded was 135 μg/l, which is greater than the acceptable limit, which causes algal bloom in the rivers, ultimately increasing the Chemical Oxygen Demand, reducing the dissolved oxygen. The continuous change in the phosphorous limit could also be a cause of cyclic dissolved oxygen. | * Phosphorus is very important for any plant to grow healthier and the optimum level of phosphorous is essential to be present in the water, but if the limit of phosphorus exceeds the permissible limit, then it directly reduces the dissolved oxygen present in the water. The permissible limit of phosphorus in a river stream should be less than 100 μg/l, but the Mistford data gives us the mean of average phosphorous recorded was 135 μg/l, which is greater than the acceptable limit, which causes algal bloom in the rivers, ultimately increasing the Chemical Oxygen Demand, reducing the dissolved oxygen. The continuous change in the phosphorous limit could also be a cause of cyclic dissolved oxygen. | ||
* During the past years record, there was a sudden increase in the amount of phosphorous at November 2006, such a huge measure of phosphorous is only possible with any industry discharge of stored effluents into the water system. And then during the most recent years of analysis, repeatedly there was surge of the measure especially in June and December months. | * During the past years record, there was a sudden increase in the amount of phosphorous at November 2006, such a huge measure of phosphorous is only possible with any industry discharge of stored effluents into the water system. And then during the most recent years of analysis, repeatedly there was surge of the measure especially in June and December months. | ||
| − | [[File:5 12.5.png| | + | [[File:5 12.5.png|700px|centre]]<br/> |
===<font size = 3>Location analysis</font>=== | ===<font size = 3>Location analysis</font>=== | ||
* When analyzing on the locations over the past and the present years, in the past years the Kohsoom recorded the highest ever reading of average phosphorous in the water system of 256 μg/l while in the most recent years category, Tansanee recorded the highest value of 200 μg/l. | * When analyzing on the locations over the past and the present years, in the past years the Kohsoom recorded the highest ever reading of average phosphorous in the water system of 256 μg/l while in the most recent years category, Tansanee recorded the highest value of 200 μg/l. | ||
| − | [[File:6 12.6.png| | + | [[File:6 12.6.png|700px|centre]]<br/> |
==<font size = 3.5>4. Calcium:</font>== | ==<font size = 3.5>4. Calcium:</font>== | ||
===<font size = 3>Measure and Year analysis</font>=== | ===<font size = 3>Measure and Year analysis</font>=== | ||
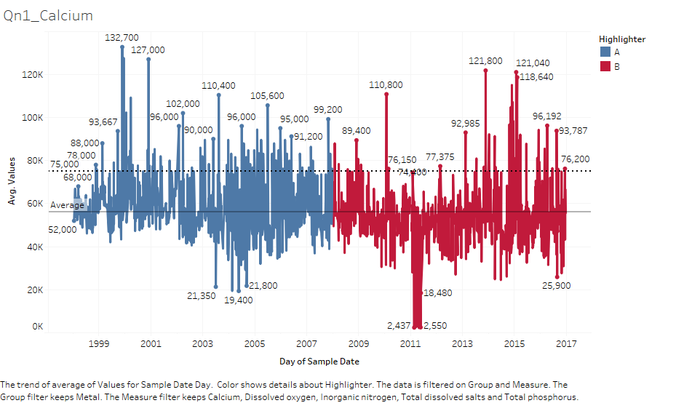
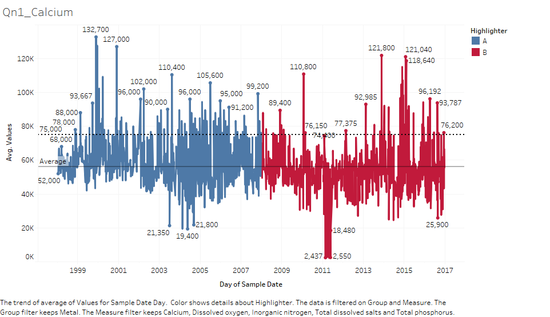
* Calcium is the most important metal occurring as salts and in other forms which directly determines the hardness of the water. The permissible limit of calcium in the water for drinking is less than 75 mg/l. in Mistford, the mean of the average value sif the calcium content in the water is well below the permissible limit. Yet there are a lot of occasions were the level of calcium crossed the permissible limit increasing the hardness of the water. In the past years data, the calcium level in the water were so high that very often the daily average value crossed the permissible limit. The highest ever daily average recorded was on November 1999. Likewise, in the most recent years, the level of calcium has reduced compared to the past years and is tracked to decline at the end of the record. | * Calcium is the most important metal occurring as salts and in other forms which directly determines the hardness of the water. The permissible limit of calcium in the water for drinking is less than 75 mg/l. in Mistford, the mean of the average value sif the calcium content in the water is well below the permissible limit. Yet there are a lot of occasions were the level of calcium crossed the permissible limit increasing the hardness of the water. In the past years data, the calcium level in the water were so high that very often the daily average value crossed the permissible limit. The highest ever daily average recorded was on November 1999. Likewise, in the most recent years, the level of calcium has reduced compared to the past years and is tracked to decline at the end of the record. | ||
| − | [[File:7 12.7.png| | + | [[File:7 12.7.png|700px|centre]]<br/> |
===<font size = 3>Location analysis</font>=== | ===<font size = 3>Location analysis</font>=== | ||
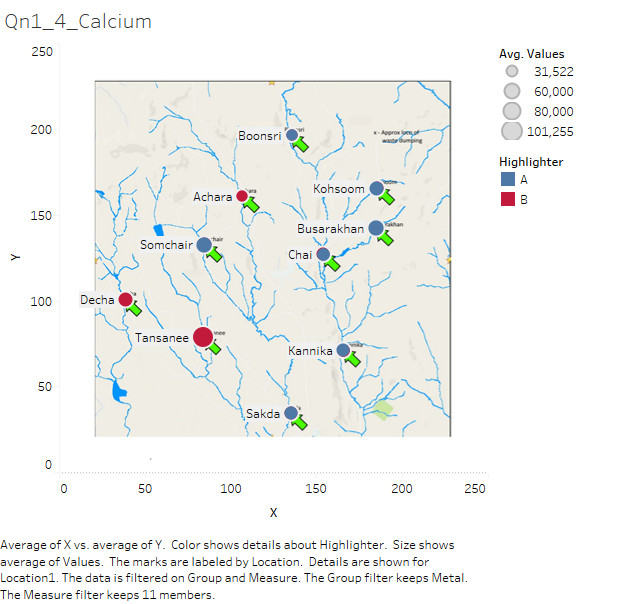
* The highest ever calcium value recorded over the 10 locations, is the Tansanee which is predominantly dominated over the most recent years has a value of 101 mg/l, while the Kohsoom recorded the highest average value for the past data of 59 mg/l. | * The highest ever calcium value recorded over the 10 locations, is the Tansanee which is predominantly dominated over the most recent years has a value of 101 mg/l, while the Kohsoom recorded the highest average value for the past data of 59 mg/l. | ||
| − | [[File:8 12.8.png| | + | [[File:8 12.8.png|700px|centre]]<br/> |
==<font size = 3.5>5. Petroleum Hydrocarbon:</font>== | ==<font size = 3.5>5. Petroleum Hydrocarbon:</font>== | ||
| Line 80: | Line 80: | ||
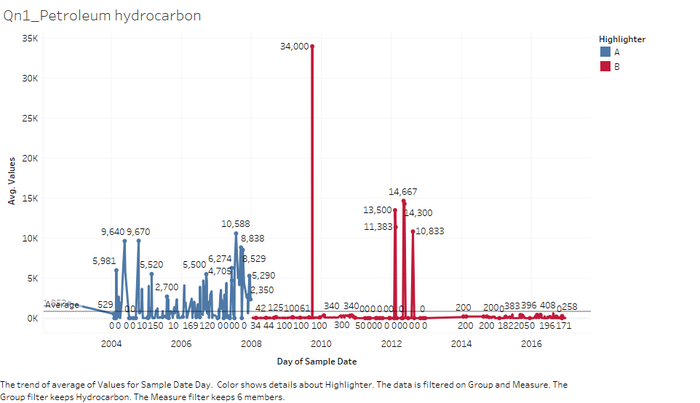
* In the past years recording of the petroleum hydrocarbon data, the level of surge and fall very so high in shirt duration. The data of the petroleum hydrocarbon products is taken in the Mistford from 2003 till 2016. The mean of the average value for the past years section is 1.6 mg/l while the mean of the average value of most recent years section is 0.4 mg/l. Even though the past years data is from 2003 till 2007, the level of maximum values reached every day was so high in the past than the recent years. | * In the past years recording of the petroleum hydrocarbon data, the level of surge and fall very so high in shirt duration. The data of the petroleum hydrocarbon products is taken in the Mistford from 2003 till 2016. The mean of the average value for the past years section is 1.6 mg/l while the mean of the average value of most recent years section is 0.4 mg/l. Even though the past years data is from 2003 till 2007, the level of maximum values reached every day was so high in the past than the recent years. | ||
* The data gives us a deeper insight of the past years recordings with the recent years recordings. In the past years, there were too much industrial waste or petroleum dumping to the water system and then immediately they would take an action to clean it. But again, they dumped the products, this was repeatedly happening, but after the recent years the actual petroleum products in the water system has reduced drastically, showing the proper actions taken. But suddenly there was a huge pour out of all the petroleum hydrocarbons into the water system in a single day – September 2009. And then in 2012 in a span of 3 months, again repeated high level readings of data were noticed. | * The data gives us a deeper insight of the past years recordings with the recent years recordings. In the past years, there were too much industrial waste or petroleum dumping to the water system and then immediately they would take an action to clean it. But again, they dumped the products, this was repeatedly happening, but after the recent years the actual petroleum products in the water system has reduced drastically, showing the proper actions taken. But suddenly there was a huge pour out of all the petroleum hydrocarbons into the water system in a single day – September 2009. And then in 2012 in a span of 3 months, again repeated high level readings of data were noticed. | ||
| − | [[File:9 12.9.png| | + | [[File:9 12.9.png|700px|centre]]<br/> |
===<font size = 3>Location analysis</font>=== | ===<font size = 3>Location analysis</font>=== | ||
* As we know the readings were so high during the past years, the Kannika – Source point of water into the dumping region has recorded the highest mean petroleum products value over the span of 5 years of 2.7 mg/l. The most recent years section has recorded negligible average readings, the highest was in Tansanee with 180 μg/l. | * As we know the readings were so high during the past years, the Kannika – Source point of water into the dumping region has recorded the highest mean petroleum products value over the span of 5 years of 2.7 mg/l. The most recent years section has recorded negligible average readings, the highest was in Tansanee with 180 μg/l. | ||
| − | [[File:10 12.10.png| | + | [[File:10 12.10.png|700px|centre]]<br/> |
==<font size = 3.5>6. Lead:</font>== | ==<font size = 3.5>6. Lead:</font>== | ||
| Line 89: | Line 89: | ||
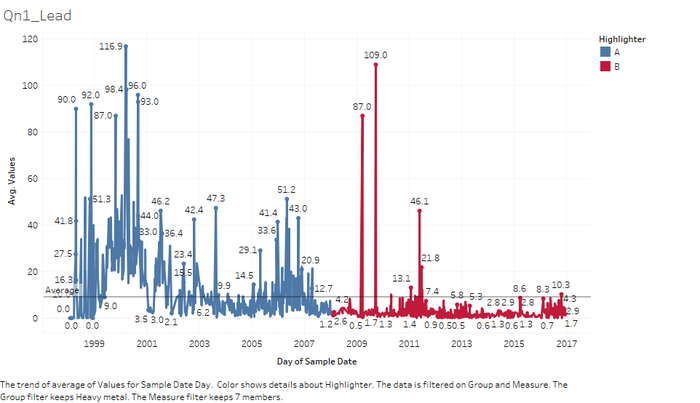
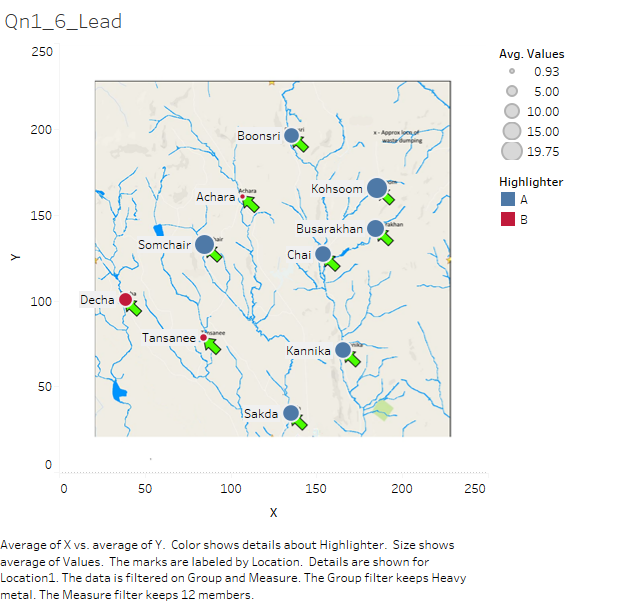
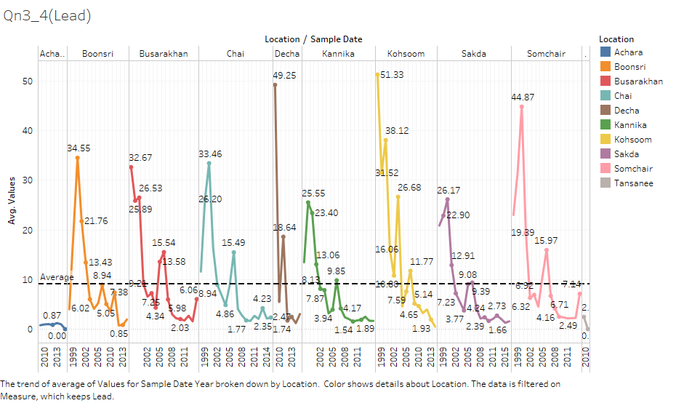
* The lead is one of the most poisonous heavy metal if consumed over the permissible limit. According to the WHO, (Ref 4) the drinking water can have a maximum limit of 15 μg/l of lead in it to consider itself good for drinking. In the analysis of the Mistford over the lead contamination of the water, the past records is so shocking that the lead presence in the water is so very high compared with the most recent years case. The overall average value from 1998 till 2007, shows the mean value of the average lead in the water is 13.3 μg/l, but had many occasions where the lead was invariably dumped more than recommended into the water. The highest recording of lead in the water was noted on March 2000. | * The lead is one of the most poisonous heavy metal if consumed over the permissible limit. According to the WHO, (Ref 4) the drinking water can have a maximum limit of 15 μg/l of lead in it to consider itself good for drinking. In the analysis of the Mistford over the lead contamination of the water, the past records is so shocking that the lead presence in the water is so very high compared with the most recent years case. The overall average value from 1998 till 2007, shows the mean value of the average lead in the water is 13.3 μg/l, but had many occasions where the lead was invariably dumped more than recommended into the water. The highest recording of lead in the water was noted on March 2000. | ||
* In the recent years record, the lead in the water were greatly reduced below the permissible value, except for two occasions where the value recorded the highest ever reading – 109 μg/l on September 2009. After that all the readings were less than the permissible value. It looks like, the lead is stored in some way in the industry and shed off at one point into the water stream. | * In the recent years record, the lead in the water were greatly reduced below the permissible value, except for two occasions where the value recorded the highest ever reading – 109 μg/l on September 2009. After that all the readings were less than the permissible value. It looks like, the lead is stored in some way in the industry and shed off at one point into the water stream. | ||
| − | [[File:11 12.11.png| | + | [[File:11 12.11.png|700px|centre]]<br/> |
===<font size = 3>Location analysis</font>=== | ===<font size = 3>Location analysis</font>=== | ||
* The Decha has recorded highest most recent years mean lead value of 8.05 μg/l, while the past years data shows that the Kohsoom had the highest ever average lead contamination over the years with a value of 19.75 μg/l, followed by Somchair with 17.70 μg/l. | * The Decha has recorded highest most recent years mean lead value of 8.05 μg/l, while the past years data shows that the Kohsoom had the highest ever average lead contamination over the years with a value of 19.75 μg/l, followed by Somchair with 17.70 μg/l. | ||
| − | [[File:12 12.12.png| | + | [[File:12 12.12.png|700px|centre]]<br/> |
==<font size = 3.5>7. Total Hardness:</font>== | ==<font size = 3.5>7. Total Hardness:</font>== | ||
| Line 101: | Line 101: | ||
|- | |- | ||
| | | | ||
| − | <b>[[File:13 12.7.png| | + | <b>[[File:13 12.7.png|550px|centre]]</b> |
|| | || | ||
| − | <b>[[File:14 12.13.png| | + | <b>[[File:14 12.13.png|550px|centre]]</b> |
|}<br/> | |}<br/> | ||
===<font size = 3>Location analysis</font>=== | ===<font size = 3>Location analysis</font>=== | ||
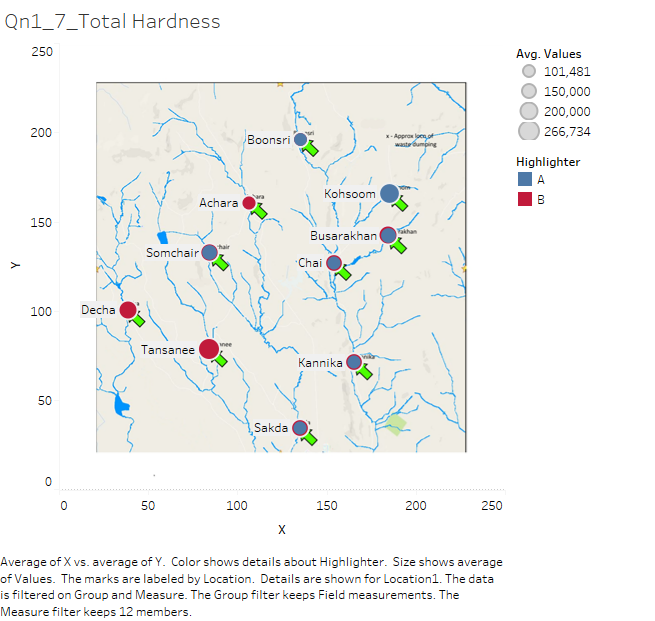
* Regarding the analysis of the location for the hardness, the past year data recordings shows that the hardness value is the highest for the Kohsoom with 234 mg/l. The Somchair, Chai and Busarakhan have their past and the most recent hardness vales almost equally shared between hence they stand shared between the past and the recent. The location with the highest mean hardness value is the Tansanee with 266 mg/l. | * Regarding the analysis of the location for the hardness, the past year data recordings shows that the hardness value is the highest for the Kohsoom with 234 mg/l. The Somchair, Chai and Busarakhan have their past and the most recent hardness vales almost equally shared between hence they stand shared between the past and the recent. The location with the highest mean hardness value is the Tansanee with 266 mg/l. | ||
| − | [[File:15 12.14.png| | + | [[File:15 12.14.png|700px|centre]]<br/> |
==<font size = 3.5>8. Chemical Oxygen Demand (Mn):</font>== | ==<font size = 3.5>8. Chemical Oxygen Demand (Mn):</font>== | ||
===<font size = 3>Measure and Year analysis</font>=== | ===<font size = 3>Measure and Year analysis</font>=== | ||
* The Chemical Oxygen Demand (Mn) is the amount of oxygen needed to oxidize the oxidaizable matter in the water. This is tested using the potassium permanganate (KMnO4) – a strong oxidizing agent. Higher the COD value higher the bacteria and other stuff, lower the dissolved oxygen and higher the oxygen saturation. In the past year data analysis of the Mistford, the data has been fluctuating to find any insights from it. But with the recent years COD record, it’s very evident that the highest ever recorded COD value is June 2009 and in July 2014 reaching a value of 28 mg/l each. | * The Chemical Oxygen Demand (Mn) is the amount of oxygen needed to oxidize the oxidaizable matter in the water. This is tested using the potassium permanganate (KMnO4) – a strong oxidizing agent. Higher the COD value higher the bacteria and other stuff, lower the dissolved oxygen and higher the oxygen saturation. In the past year data analysis of the Mistford, the data has been fluctuating to find any insights from it. But with the recent years COD record, it’s very evident that the highest ever recorded COD value is June 2009 and in July 2014 reaching a value of 28 mg/l each. | ||
| − | [[File:16 12.15.png| | + | [[File:16 12.15.png|700px|centre]]<br/> |
===<font size = 3>Location analysis</font>=== | ===<font size = 3>Location analysis</font>=== | ||
* The Decha has the highest COD (Mn) in the recent years of COD calculations having an average value of 7 mg/l, while the Kohsoom reached the ever-highest COD (Mn) with the value of 8.3 mg/l on an average. | * The Decha has the highest COD (Mn) in the recent years of COD calculations having an average value of 7 mg/l, while the Kohsoom reached the ever-highest COD (Mn) with the value of 8.3 mg/l on an average. | ||
| − | [[File:17 12.16.png| | + | [[File:17 12.16.png|700px|centre]]<br/> |
| Line 123: | Line 123: | ||
* Considering the analysis of Mercury in the Boonsong Lekagul waterways in Mistford, the data is insufficient to find the exact potential problem due to mercury contamination in the waterways. The actual recording data are taken starting from 1998 till 2016. But the readings for mercury has started only from 2005 at the earliest and ended by the end of 2016. This is not the uniform scenario in all the locations. Places like the Busarakhan, Kannika, Sakda have the values starting from 2005 till 2015. Achara has the reading recorded from 2010 till 2016. Readings at Tansanee has been taken only on 2015. | * Considering the analysis of Mercury in the Boonsong Lekagul waterways in Mistford, the data is insufficient to find the exact potential problem due to mercury contamination in the waterways. The actual recording data are taken starting from 1998 till 2016. But the readings for mercury has started only from 2005 at the earliest and ended by the end of 2016. This is not the uniform scenario in all the locations. Places like the Busarakhan, Kannika, Sakda have the values starting from 2005 till 2015. Achara has the reading recorded from 2010 till 2016. Readings at Tansanee has been taken only on 2015. | ||
* Irregular data collection with improper uniformity is the major anomaly to conclude any important decision for the accusing any industry or factuating the results with certainty of the past or couldn’t take the insights to predict the future. | * Irregular data collection with improper uniformity is the major anomaly to conclude any important decision for the accusing any industry or factuating the results with certainty of the past or couldn’t take the insights to predict the future. | ||
| − | [[File:18 12.17.png| | + | [[File:18 12.17.png|700px|centre]]<br/> |
==<font size = 3.5>2. Water Temperature:</font>== | ==<font size = 3.5>2. Water Temperature:</font>== | ||
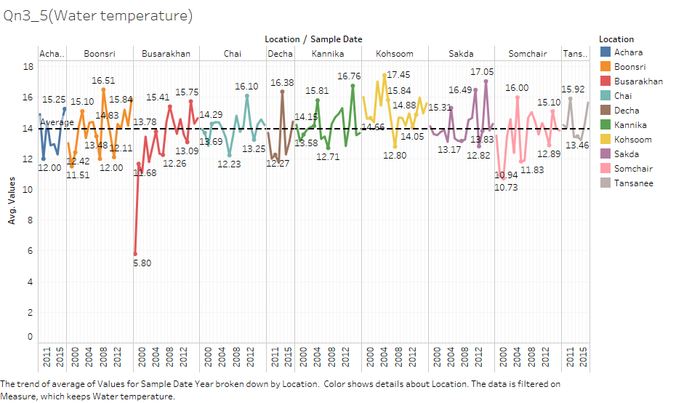
* In Busarakhan, the value of the water temperature is taken from 2000 until 2013 only. At 2000 the average water temperature was 9-degree C. The temperature data of the previous 2 years are missing to conclude on the very low temperature beginning of Busarakhan. | * In Busarakhan, the value of the water temperature is taken from 2000 until 2013 only. At 2000 the average water temperature was 9-degree C. The temperature data of the previous 2 years are missing to conclude on the very low temperature beginning of Busarakhan. | ||
* Achara, Decha and Tansanee had the record of water temperature starting from 2011 till 2015. None of the values have been recorded for the entire period. | * Achara, Decha and Tansanee had the record of water temperature starting from 2011 till 2015. None of the values have been recorded for the entire period. | ||
| − | [[File:19 12.18.png| | + | [[File:19 12.18.png|700px|centre]]<br/> |
==<font size = 3.5>3. Sulphates:</font>== | ==<font size = 3.5>3. Sulphates:</font>== | ||
• One of the major anomaly is the missing values between two years of recording. For example, in Achara and Tansanee, the first reading was taken at 2009 but the next reading was at 2013. This particular gap in the reading of the Sulphates will bring in missing trends in the values, making analysts incapable of bringing a decisive result from it. | • One of the major anomaly is the missing values between two years of recording. For example, in Achara and Tansanee, the first reading was taken at 2009 but the next reading was at 2013. This particular gap in the reading of the Sulphates will bring in missing trends in the values, making analysts incapable of bringing a decisive result from it. | ||
| − | [[File:20 12.19.png| | + | [[File:20 12.19.png|700px|centre]]<br/> |
==<font size = 3.5>4. Location - Tansanee:</font>== | ==<font size = 3.5>4. Location - Tansanee:</font>== | ||
| Line 139: | Line 139: | ||
|- | |- | ||
| | | | ||
| − | <b>[[File:21 12.20.png| | + | <b>[[File:21 12.20.png|450px|centre]]</b> |
|| | || | ||
<b>[[File:22 12.21.png|300px|centre]]</b> | <b>[[File:22 12.21.png|300px|centre]]</b> | ||
| Line 148: | Line 148: | ||
==<font size = 3.5>5. Missing Location:</font>== | ==<font size = 3.5>5. Missing Location:</font>== | ||
* This anomaly is very peculiar in the case, that three of the locations have been missed out of the calculation for the Cyanide chemical. The places such as the Boonsri, Tansanee and Kohsoom, three of the most targeted places for other chemical measures. This is a biggest flaw to miss out three locations, without any information given on this specific regards (these 3 places are ruled out of the analysis for some reasons ). | * This anomaly is very peculiar in the case, that three of the locations have been missed out of the calculation for the Cyanide chemical. The places such as the Boonsri, Tansanee and Kohsoom, three of the most targeted places for other chemical measures. This is a biggest flaw to miss out three locations, without any information given on this specific regards (these 3 places are ruled out of the analysis for some reasons ). | ||
| − | [[File:24 12.23.png| | + | [[File:24 12.23.png|700px|centre]]<br/> |
| Line 155: | Line 155: | ||
==<font size = 3.5>1. Dissolved Oxygen:</font>== | ==<font size = 3.5>1. Dissolved Oxygen:</font>== | ||
* The dissolved oxygen is the main parameter that decides the number of living organism that thrives in the water stream. The blue pipit is a bird that feeds on small invertebrates and the invertebrates tend to live more near the water basin feeding on the water plants and other organism. At 9.5 mg/l mark all the locations in the Mistford has seen a downward trend in the dissolved oxygen during the last few years of analysis. All the locations dissolved oxygen level has reduced which is an indirect threat to the blue pipit. | * The dissolved oxygen is the main parameter that decides the number of living organism that thrives in the water stream. The blue pipit is a bird that feeds on small invertebrates and the invertebrates tend to live more near the water basin feeding on the water plants and other organism. At 9.5 mg/l mark all the locations in the Mistford has seen a downward trend in the dissolved oxygen during the last few years of analysis. All the locations dissolved oxygen level has reduced which is an indirect threat to the blue pipit. | ||
| − | [[File:25 12.24.png| | + | [[File:25 12.24.png|700px|centre]]<br/> |
==<font size = 3.5>2. Arsenic:</font>== | ==<font size = 3.5>2. Arsenic:</font>== | ||
* The Arsenic is very poisonous to any animal or organism that consumes it. In the natural scenario, arsenic is found to be in water and if consumed over a period, then it leads to malicious diseases. In the Mistford, the Arsenic content is on the rise and threats the living organism in the reserve area. The analysis suggests that the level of arsenic is on the rise and if its grows over 3 μg/l, then it potentially can destroy the habitable environment in Mistford. | * The Arsenic is very poisonous to any animal or organism that consumes it. In the natural scenario, arsenic is found to be in water and if consumed over a period, then it leads to malicious diseases. In the Mistford, the Arsenic content is on the rise and threats the living organism in the reserve area. The analysis suggests that the level of arsenic is on the rise and if its grows over 3 μg/l, then it potentially can destroy the habitable environment in Mistford. | ||
| − | [[File:26 12.25.png| | + | [[File:26 12.25.png|700px|centre]]<br/> |
==<font size = 3.5>3. Calcium:</font>== | ==<font size = 3.5>3. Calcium:</font>== | ||
* The calcium is one of the important metal to be present in the water only to a certain extent. If the total calcium content exceeds the permissible limit, then it increases the COD of the water, indirectly decreasing the dissolved oxygen and making life miserable in the locality. Upon the analysis, we find that the calcium levels in the entire 10 locations are on the brink of crossing the permissible limit. The increase in the calcium will indirectly threatens the life of blue pipit in the region. | * The calcium is one of the important metal to be present in the water only to a certain extent. If the total calcium content exceeds the permissible limit, then it increases the COD of the water, indirectly decreasing the dissolved oxygen and making life miserable in the locality. Upon the analysis, we find that the calcium levels in the entire 10 locations are on the brink of crossing the permissible limit. The increase in the calcium will indirectly threatens the life of blue pipit in the region. | ||
| − | [[File:27 12.26.png| | + | [[File:27 12.26.png|700px|centre]]<br/> |
==<font size = 3.5>4. Lead:</font>== | ==<font size = 3.5>4. Lead:</font>== | ||
* The lead is another heavy metal which can cause health issues to the organism consuming the water. The positive trend analyzed throughout the period in all the location before 2014 was the downward trend of lead throughout the region. But, the value of lead has stopped its downward motion and started to increase in the last 1 year of the analysis. This if continuous to increase the way it has started, the blue pipit will severally be in danger because of this increase in the lead quantity. | * The lead is another heavy metal which can cause health issues to the organism consuming the water. The positive trend analyzed throughout the period in all the location before 2014 was the downward trend of lead throughout the region. But, the value of lead has stopped its downward motion and started to increase in the last 1 year of the analysis. This if continuous to increase the way it has started, the blue pipit will severally be in danger because of this increase in the lead quantity. | ||
| − | [[File:28 12.27.png| | + | [[File:28 12.27.png|700px|centre]]<br/> |
==<font size = 3.5>5. Water temperature:</font>== | ==<font size = 3.5>5. Water temperature:</font>== | ||
* As we have analyzed all the other chemicals from salts, oxygen, metals, field measurements all have given us that the hardness value of the water is on the rise and hence the Ph value will reduce making the water to increase in temperature creating more oxidaizable material to thrive more, increasing the chemical oxygen demand there by reducing the dissolved oxygen. All this are interrelated and finally projects threat to the blue pipit survival in the Mistford. From the below graph its evident that the average temperature of each locations has started to rise. | * As we have analyzed all the other chemicals from salts, oxygen, metals, field measurements all have given us that the hardness value of the water is on the rise and hence the Ph value will reduce making the water to increase in temperature creating more oxidaizable material to thrive more, increasing the chemical oxygen demand there by reducing the dissolved oxygen. All this are interrelated and finally projects threat to the blue pipit survival in the Mistford. From the below graph its evident that the average temperature of each locations has started to rise. | ||
| − | [[File:29 12.28.png| | + | [[File:29 12.28.png|700px|centre]]<br/> |
Revision as of 14:02, 8 July 2018
|
|
|
|
|
|
|
|
For the Mini Challenge 2 of The VAST Challenge 2018, there are a series of three questions to be answered based on the visualization done earlier. The final task is to investigate the hydrology data from across the Preserve. You are given a map of the Preserve (with the same base as last year’s challenge), with named sampling sites indicated on the map (the names have local significance, but are just mnemonics for your study) You are also provided with readings from each sampling station over time for several different chemicals and water properties.
Note: The entire record period (1998-2016) is split into 2 periods, from 1998 till the end of 2007 as the “past” and the years from 2008 till end of 2016 is taken as “most recent situation”.
Contents
- 1 Question 1 : Characterize the past and most recent situation with respect to chemical contamination in the Boonsong Lekagul waterways. Do you see any trends of possible interest in this investigation? Your submission for this question should contain no more than 10 images and 1000 words.
- 2 Question 2 : What anomalies do you find in the waterway samples dataset? How do these affect your analysis of potential problems to the environment? Is the Hydrology Department collecting sufficient data to understand the comprehensive situation across the Preserve? What changes would you propose to make in the sampling approach to best understand the situation? Your submission for this question should contain no more than 6 images and 500 words.
- 3 Question 3 : After reviewing the data, do any of your findings cause particular concern for the Pipit or other wildlife? Would you suggest any changes in the sampling strategy to better understand the waterways situation in the Preserve? Your submission for this question should contain no more than 6 images and 500 words.
Question 1 : Characterize the past and most recent situation with respect to chemical contamination in the Boonsong Lekagul waterways. Do you see any trends of possible interest in this investigation? Your submission for this question should contain no more than 10 images and 1000 words.
1. Total Dissolved salts:
Measure and Year analysis
- From the recorded measurements of total dissolved salts from 2005 till 2016, the past readings, from 2005 – 2007, had values on an average less than the readings of the most recent year’s average. The highest ever recording a total dissolved salt was on January 2009 of 1 g/l, while even the values are fluctuating, the maximum average value has always been more than 500 mg/l from 2009-2016.
- While closely looking at the minimum values of the average total dissolved salts in the water, over the recent years has always followed a cyclicity trend between 176 mg/l to 300 mg/l in the mid-quarter (June, July, August and September) of every year.
Location analysis
- In the past, the mean average values for the total dissolved salts were higher to Busarakhan with a mean value of 444 mg/l followed by Somchair with 443 mg/l, while the least in the past year was at Boonsri with 245 mg/l. when comparing the past with the most recent years data, the Tansanee has the highest of all recording 733 mg/l of total dissolved salts in the waterway.
2. Dissolved Oxygen:
Measure and Year analysis
- Ever since the start of recording the measurement across the Mistford, the Dissolved oxygen has always been with the perfect cycle. Since the start, every mid-quarter of the year the value has dropped to the lowest in that year and then it again shoots up to the maximum of the year at the starting quarter (January – February - March). This cycle has been repeated all around the years.
- The lowest dissolved oxygen value ever record was on December 1998 where the value reached 0 mg/l, while the maximum over recorded dissolved oxygen value was on July 2010, at a massive 15.9 mg/l.
Location analysis
- Over the past years record, Chai has recorded the highest mean average value of dissolved oxygen of 8.6 mg/l. The right side of the map of Mistford was completely dominant in the past records while the left of the median in the map was more dominant in the most recent years. In the recent years, the Decha has recorded the highest ever average dissolved oxygen of 10 mg/l.
3. Total Phosphorus:
Measure and Year analysis
- Phosphorus is very important for any plant to grow healthier and the optimum level of phosphorous is essential to be present in the water, but if the limit of phosphorus exceeds the permissible limit, then it directly reduces the dissolved oxygen present in the water. The permissible limit of phosphorus in a river stream should be less than 100 μg/l, but the Mistford data gives us the mean of average phosphorous recorded was 135 μg/l, which is greater than the acceptable limit, which causes algal bloom in the rivers, ultimately increasing the Chemical Oxygen Demand, reducing the dissolved oxygen. The continuous change in the phosphorous limit could also be a cause of cyclic dissolved oxygen.
- During the past years record, there was a sudden increase in the amount of phosphorous at November 2006, such a huge measure of phosphorous is only possible with any industry discharge of stored effluents into the water system. And then during the most recent years of analysis, repeatedly there was surge of the measure especially in June and December months.
Location analysis
- When analyzing on the locations over the past and the present years, in the past years the Kohsoom recorded the highest ever reading of average phosphorous in the water system of 256 μg/l while in the most recent years category, Tansanee recorded the highest value of 200 μg/l.
4. Calcium:
Measure and Year analysis
- Calcium is the most important metal occurring as salts and in other forms which directly determines the hardness of the water. The permissible limit of calcium in the water for drinking is less than 75 mg/l. in Mistford, the mean of the average value sif the calcium content in the water is well below the permissible limit. Yet there are a lot of occasions were the level of calcium crossed the permissible limit increasing the hardness of the water. In the past years data, the calcium level in the water were so high that very often the daily average value crossed the permissible limit. The highest ever daily average recorded was on November 1999. Likewise, in the most recent years, the level of calcium has reduced compared to the past years and is tracked to decline at the end of the record.
Location analysis
- The highest ever calcium value recorded over the 10 locations, is the Tansanee which is predominantly dominated over the most recent years has a value of 101 mg/l, while the Kohsoom recorded the highest average value for the past data of 59 mg/l.
5. Petroleum Hydrocarbon:
Measure and Year analysis
- In the past years recording of the petroleum hydrocarbon data, the level of surge and fall very so high in shirt duration. The data of the petroleum hydrocarbon products is taken in the Mistford from 2003 till 2016. The mean of the average value for the past years section is 1.6 mg/l while the mean of the average value of most recent years section is 0.4 mg/l. Even though the past years data is from 2003 till 2007, the level of maximum values reached every day was so high in the past than the recent years.
- The data gives us a deeper insight of the past years recordings with the recent years recordings. In the past years, there were too much industrial waste or petroleum dumping to the water system and then immediately they would take an action to clean it. But again, they dumped the products, this was repeatedly happening, but after the recent years the actual petroleum products in the water system has reduced drastically, showing the proper actions taken. But suddenly there was a huge pour out of all the petroleum hydrocarbons into the water system in a single day – September 2009. And then in 2012 in a span of 3 months, again repeated high level readings of data were noticed.
Location analysis
- As we know the readings were so high during the past years, the Kannika – Source point of water into the dumping region has recorded the highest mean petroleum products value over the span of 5 years of 2.7 mg/l. The most recent years section has recorded negligible average readings, the highest was in Tansanee with 180 μg/l.
6. Lead:
Measure and Year analysis
- The lead is one of the most poisonous heavy metal if consumed over the permissible limit. According to the WHO, (Ref 4) the drinking water can have a maximum limit of 15 μg/l of lead in it to consider itself good for drinking. In the analysis of the Mistford over the lead contamination of the water, the past records is so shocking that the lead presence in the water is so very high compared with the most recent years case. The overall average value from 1998 till 2007, shows the mean value of the average lead in the water is 13.3 μg/l, but had many occasions where the lead was invariably dumped more than recommended into the water. The highest recording of lead in the water was noted on March 2000.
- In the recent years record, the lead in the water were greatly reduced below the permissible value, except for two occasions where the value recorded the highest ever reading – 109 μg/l on September 2009. After that all the readings were less than the permissible value. It looks like, the lead is stored in some way in the industry and shed off at one point into the water stream.
Location analysis
- The Decha has recorded highest most recent years mean lead value of 8.05 μg/l, while the past years data shows that the Kohsoom had the highest ever average lead contamination over the years with a value of 19.75 μg/l, followed by Somchair with 17.70 μg/l.
7. Total Hardness:
Measure and Year analysis
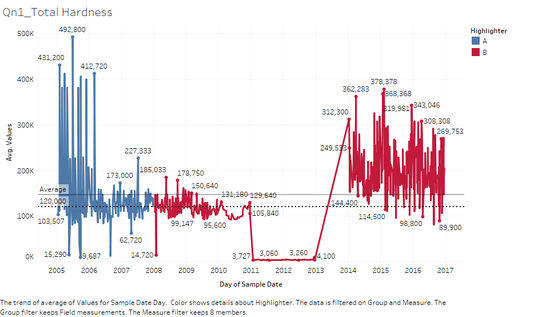
- The Total Hardness records have been taken from 2005 till 2016. The hardness of the water was so high during past years section of analysis, where the hardness where consistently above average. The mean of the total average of hardness value is well above the permissible limit of very hard water (120 mg/l). The average of the value for the past years alone is 138 mg/l with the highest value recorded of 492 mg/l. On the contrary, for the recent years analysis, the average is well above the permissible limit, with 150 mg/l.
- This analysis gives the direct evidence of calcium determines the hardness of the water. When comparing with the calcium data set for the recent years section, during the 2011 till 2013, the calcium levels were so less, near to 0 mg/l. This has directly caused the hardness of the water to drop to the lowest of all – a mean of 3 mg/l.
Location analysis
- Regarding the analysis of the location for the hardness, the past year data recordings shows that the hardness value is the highest for the Kohsoom with 234 mg/l. The Somchair, Chai and Busarakhan have their past and the most recent hardness vales almost equally shared between hence they stand shared between the past and the recent. The location with the highest mean hardness value is the Tansanee with 266 mg/l.
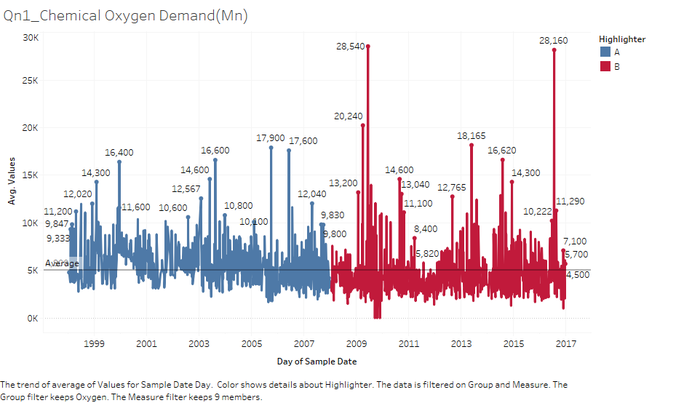
8. Chemical Oxygen Demand (Mn):
Measure and Year analysis
- The Chemical Oxygen Demand (Mn) is the amount of oxygen needed to oxidize the oxidaizable matter in the water. This is tested using the potassium permanganate (KMnO4) – a strong oxidizing agent. Higher the COD value higher the bacteria and other stuff, lower the dissolved oxygen and higher the oxygen saturation. In the past year data analysis of the Mistford, the data has been fluctuating to find any insights from it. But with the recent years COD record, it’s very evident that the highest ever recorded COD value is June 2009 and in July 2014 reaching a value of 28 mg/l each.
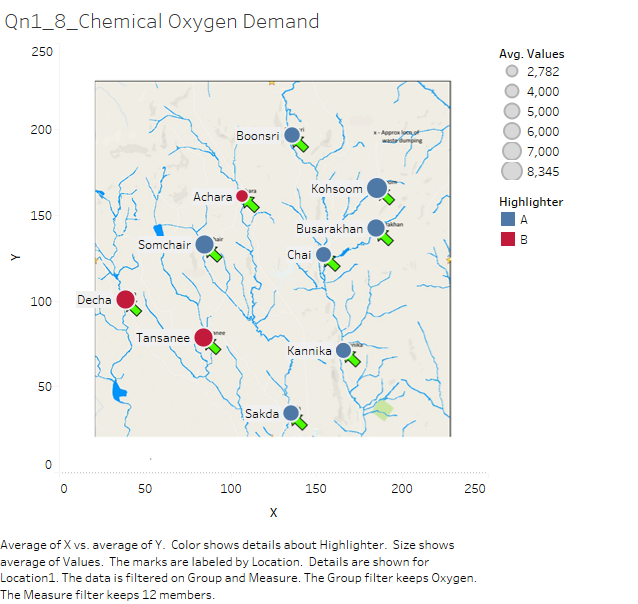
Location analysis
- The Decha has the highest COD (Mn) in the recent years of COD calculations having an average value of 7 mg/l, while the Kohsoom reached the ever-highest COD (Mn) with the value of 8.3 mg/l on an average.
Question 2 : What anomalies do you find in the waterway samples dataset? How do these affect your analysis of potential problems to the environment? Is the Hydrology Department collecting sufficient data to understand the comprehensive situation across the Preserve? What changes would you propose to make in the sampling approach to best understand the situation? Your submission for this question should contain no more than 6 images and 500 words.
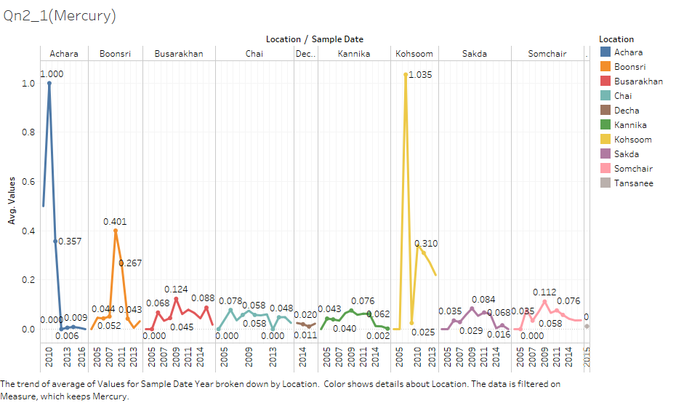
1. Mercury:
- Considering the analysis of Mercury in the Boonsong Lekagul waterways in Mistford, the data is insufficient to find the exact potential problem due to mercury contamination in the waterways. The actual recording data are taken starting from 1998 till 2016. But the readings for mercury has started only from 2005 at the earliest and ended by the end of 2016. This is not the uniform scenario in all the locations. Places like the Busarakhan, Kannika, Sakda have the values starting from 2005 till 2015. Achara has the reading recorded from 2010 till 2016. Readings at Tansanee has been taken only on 2015.
- Irregular data collection with improper uniformity is the major anomaly to conclude any important decision for the accusing any industry or factuating the results with certainty of the past or couldn’t take the insights to predict the future.
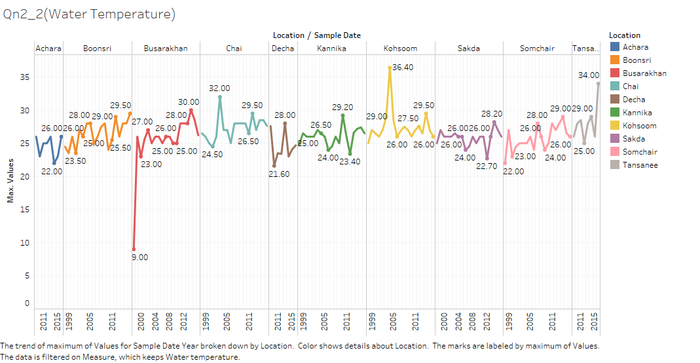
2. Water Temperature:
- In Busarakhan, the value of the water temperature is taken from 2000 until 2013 only. At 2000 the average water temperature was 9-degree C. The temperature data of the previous 2 years are missing to conclude on the very low temperature beginning of Busarakhan.
- Achara, Decha and Tansanee had the record of water temperature starting from 2011 till 2015. None of the values have been recorded for the entire period.
3. Sulphates:
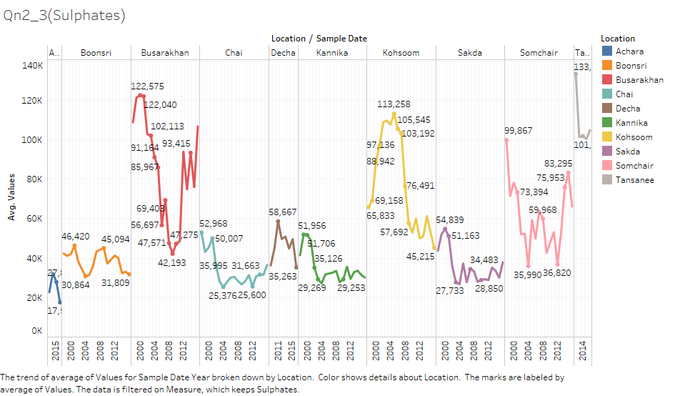
• One of the major anomaly is the missing values between two years of recording. For example, in Achara and Tansanee, the first reading was taken at 2009 but the next reading was at 2013. This particular gap in the reading of the Sulphates will bring in missing trends in the values, making analysts incapable of bringing a decisive result from it.
4. Location - Tansanee:
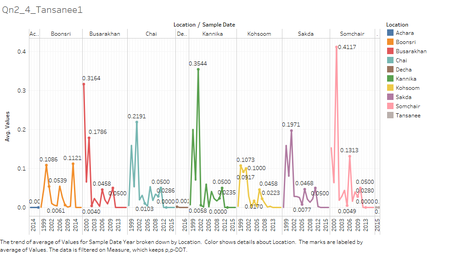
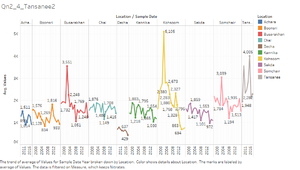
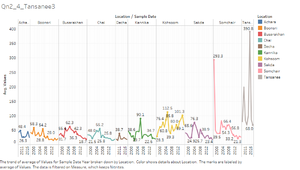
- When comparing all the different chemicals over the 10 locations, the Tansanee alone stands out with the values of all the recorded starting from 2009 are later. It’s always been taken for analysis only for the most recent years. This is one of the major anomaly to do, as the average values for most of the measures are very high for Tansanee owing to its short duration.
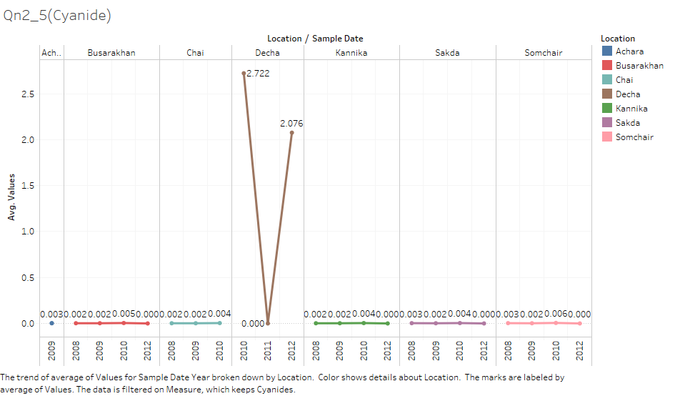
5. Missing Location:
- This anomaly is very peculiar in the case, that three of the locations have been missed out of the calculation for the Cyanide chemical. The places such as the Boonsri, Tansanee and Kohsoom, three of the most targeted places for other chemical measures. This is a biggest flaw to miss out three locations, without any information given on this specific regards (these 3 places are ruled out of the analysis for some reasons ).
Question 3 : After reviewing the data, do any of your findings cause particular concern for the Pipit or other wildlife? Would you suggest any changes in the sampling strategy to better understand the waterways situation in the Preserve? Your submission for this question should contain no more than 6 images and 500 words.
1. Dissolved Oxygen:
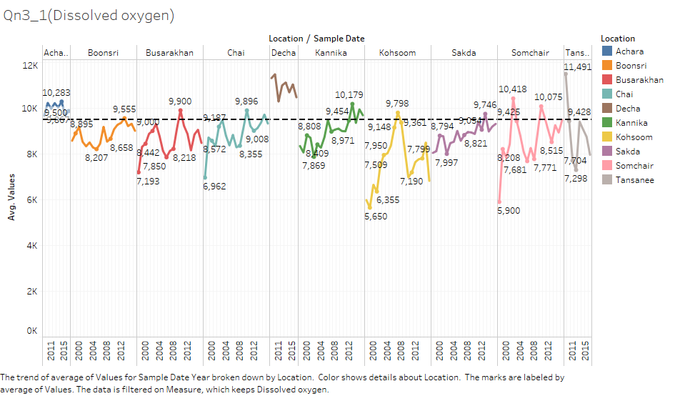
- The dissolved oxygen is the main parameter that decides the number of living organism that thrives in the water stream. The blue pipit is a bird that feeds on small invertebrates and the invertebrates tend to live more near the water basin feeding on the water plants and other organism. At 9.5 mg/l mark all the locations in the Mistford has seen a downward trend in the dissolved oxygen during the last few years of analysis. All the locations dissolved oxygen level has reduced which is an indirect threat to the blue pipit.
2. Arsenic:
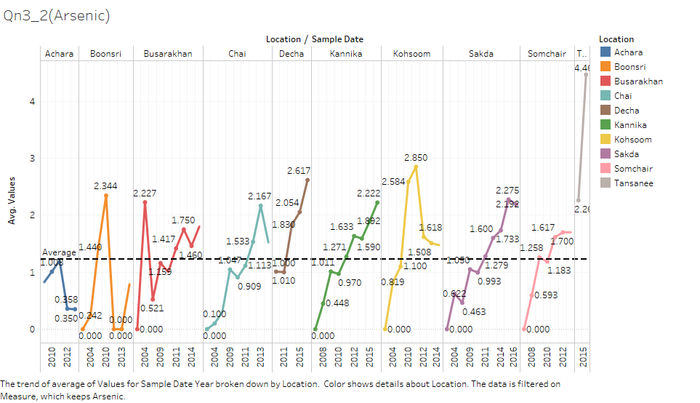
- The Arsenic is very poisonous to any animal or organism that consumes it. In the natural scenario, arsenic is found to be in water and if consumed over a period, then it leads to malicious diseases. In the Mistford, the Arsenic content is on the rise and threats the living organism in the reserve area. The analysis suggests that the level of arsenic is on the rise and if its grows over 3 μg/l, then it potentially can destroy the habitable environment in Mistford.
3. Calcium:
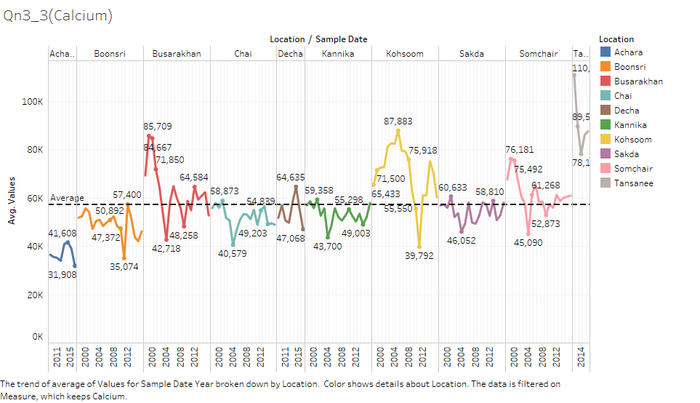
- The calcium is one of the important metal to be present in the water only to a certain extent. If the total calcium content exceeds the permissible limit, then it increases the COD of the water, indirectly decreasing the dissolved oxygen and making life miserable in the locality. Upon the analysis, we find that the calcium levels in the entire 10 locations are on the brink of crossing the permissible limit. The increase in the calcium will indirectly threatens the life of blue pipit in the region.
4. Lead:
- The lead is another heavy metal which can cause health issues to the organism consuming the water. The positive trend analyzed throughout the period in all the location before 2014 was the downward trend of lead throughout the region. But, the value of lead has stopped its downward motion and started to increase in the last 1 year of the analysis. This if continuous to increase the way it has started, the blue pipit will severally be in danger because of this increase in the lead quantity.
5. Water temperature:
- As we have analyzed all the other chemicals from salts, oxygen, metals, field measurements all have given us that the hardness value of the water is on the rise and hence the Ph value will reduce making the water to increase in temperature creating more oxidaizable material to thrive more, increasing the chemical oxygen demand there by reducing the dissolved oxygen. All this are interrelated and finally projects threat to the blue pipit survival in the Mistford. From the below graph its evident that the average temperature of each locations has started to rise.

