Difference between revisions of "ISSS608 2016-17 T3 Assign Jan Patrick Mabilangan Gosioco Data Prep"
Jump to navigation
Jump to search
(Created page with "<div> 165px <b><font size = 6> VAST Challenge 2018: Suspense at the Wildlife Preserve </font></b> </div> ISSS608_2017-18_T3_Assign_Jan_Patrick_Mabila...") |
|||
| Line 7: | Line 7: | ||
<font size="5">'''Data Preparation & Dashboard Design'''</font> | <font size="5">'''Data Preparation & Dashboard Design'''</font> | ||
==Data Preparation== | ==Data Preparation== | ||
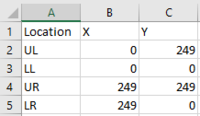
| + | 1. Create a Location.csv with the following fields and input starting values for the map borders LL, LR, UR, and UL. | ||
| + | location: location of the water sensor reading | ||
| + | X: x coordinate of the location with respect to the waterways map | ||
| + | Y: y coordinate of the location with respect to the waterways map | ||
| + | <p>[[File:Border_Coordinates.PNG|200px|center]]</p> | ||
| + | |||
| + | |||
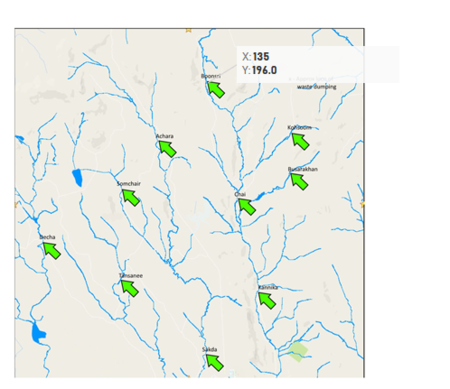
| + | 2. Derive the X and Y coordinates of the locations by loading the map into Tableau and annotating the points. | ||
| + | <p>[[File:Annotate_Map.PNG|450px|center]]</p> | ||
| + | |||
| + | |||
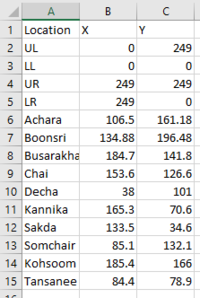
| + | 3. Update Location.csv with the derived coordinates | ||
| + | <p>[[File:Full_Location.PNG|200px|center]]</p> | ||
| + | |||
| + | |||
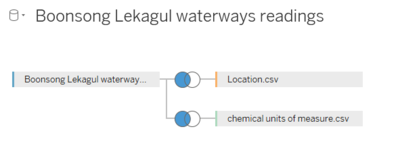
| + | 4. Import the Location.csv, Boonsong Lekagul waterways readings.csv, and chemical units of measure.csv files to Tableau, performing the join as follows: | ||
| + | : - Join on equal location fields for Location.csv | ||
| + | : - Join on equal measure fields for chemical units of measure.csv | ||
| + | <p>[[File:Joining-condition.PNG|400px|center]]</p> | ||
Revision as of 12:22, 8 July 2018
ISSS608_2017-18_T3_Assign_Jan_Patrick_Mabilangan_Gosioco
Data Preparation & Dashboard Design
Data Preparation
1. Create a Location.csv with the following fields and input starting values for the map borders LL, LR, UR, and UL. location: location of the water sensor reading X: x coordinate of the location with respect to the waterways map Y: y coordinate of the location with respect to the waterways map
2. Derive the X and Y coordinates of the locations by loading the map into Tableau and annotating the points.
3. Update Location.csv with the derived coordinates
4. Import the Location.csv, Boonsong Lekagul waterways readings.csv, and chemical units of measure.csv files to Tableau, performing the join as follows:
- - Join on equal location fields for Location.csv
- - Join on equal measure fields for chemical units of measure.csv


