Difference between revisions of "ISSS608 2017-18 T3 Assign Lim Wee Kiong Dashboard Design"
Jump to navigation
Jump to search

Wklim.2017 (talk | contribs) |
Wklim.2017 (talk | contribs) |
||
| Line 44: | Line 44: | ||
The sample joined data is shown here: | The sample joined data is shown here: | ||
| + | [[Image:LWKdashmed2.jpg|center|500px]] | ||
| + | |||
| + | It contained: | ||
| + | - ID: ID of the Sample Reading | ||
| + | - Value: Value of the Sample Reading | ||
| + | - Location1: Location of the Reading | ||
| + | - Sample Date: Date of the Reading | ||
| + | - Measure: The measure of the Sample Reading | ||
| + | - Unit: Unit of the Sample Reading | ||
| + | - X / Y: X and Y coordinates of the Location | ||
Back to Dropbox Page | Back to Dropbox Page | ||
[[File:Go back.png|40px|frameless|left|link=Assignment_Dropbox_G1]] | [[File:Go back.png|40px|frameless|left|link=Assignment_Dropbox_G1]] | ||
Revision as of 10:25, 8 July 2018
 VAST 2018 Mini-Challenge 2: Like a Duck to Water
|
|
|
|
|
|
|
Dashboard Methodology
Joining the Data Sources
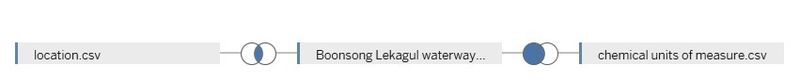
The first step is to join the 3 data sources into one and do some Exploratory Data Analysis:

Location and the Waterway data points will be joined as an inner join while the Waterway data points are joined with the units of measurements as a right outer join.
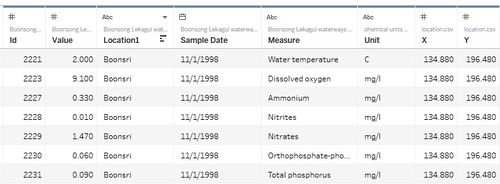
The sample joined data is shown here:

It contained: - ID: ID of the Sample Reading - Value: Value of the Sample Reading - Location1: Location of the Reading - Sample Date: Date of the Reading - Measure: The measure of the Sample Reading - Unit: Unit of the Sample Reading - X / Y: X and Y coordinates of the Location
Back to Dropbox Page