Difference between revisions of "ISSS608 2017-18 T3 Assign Jan Patrick Mabilangan Gosioco"
| Line 26: | Line 26: | ||
4. The Time | 4. The Time | ||
| − | <br> In total all over the reserve, water sensor readings were taken from January | + | <br> In total all over the reserve, water sensor readings were taken from January 11, 1998 to December 31, 2016. |
| − | <p>[[File: | + | <p>[[File:SampleDate.JPG|150px|center]]</p> |
5. The Data | 5. The Data | ||
Revision as of 10:03, 8 July 2018
Mini Challenge 2: Like a Duck to Water
According to Kasios, those funny colored satellite images from the Preserve only prove that it is a diverse, changing habitat and that the peculiar images Mitch identified are not conclusive evidence of any wrongdoing. They argue that the other industries should be taking as good care of the area as Kasios corporate and its volunteer squads do year round. To show their goodwill, Kasios reports that they recently donated staff time and money to refurbish ranger stations and campgrounds across the Preserve! Does Kasios have a case here? Perhaps some new visualization of river contaminants and analyses within the Preserve may help illustrate that the new Kasios story doesn't hold water (or does it?).
Background
View the interactive Tableau design here:
What is in the Boonsong Lekagul waterways readings dataset?
1. The Records
Professors of the Mistford College Hydrology Department have gathered a total of 136,824 water sensor readings from various locations in the rivers and streams of the preserve.
2. The Measures
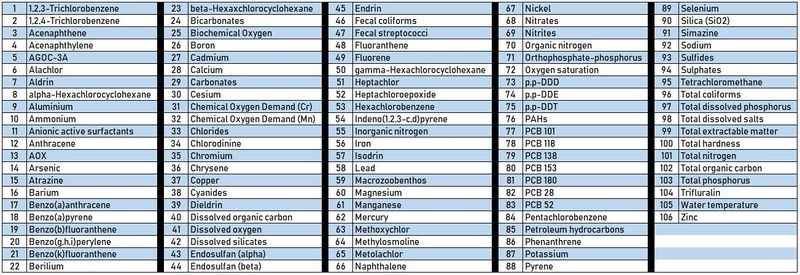
A total of 106 measures were observed.
3. The Locations
A total of 10 locations were observed.
4. The Time
In total all over the reserve, water sensor readings were taken from January 11, 1998 to December 31, 2016.
5. The Data
Boonsong Lekagul waterways readings.csv
- id: reading id
- value: value of the measure read
- location: location of the water sensor reading
- sample date: date the water sensor reading was taken
- measure: chemical or attribute whose measurement was taken
chemical units of measure.csv
- measure: chemical or attribute whose measurement was taken
- unit: unit of measurement used to quantify the measure
6. The Waterways Map


