Difference between revisions of "ISSS608 2017-18 T3 Assign Yeo Kaijun Findings"
| Line 31: | Line 31: | ||
[[File:Value of Arsenic over time.png|thumb|Img 2: Value of Arsenic over time by location]] | [[File:Value of Arsenic over time.png|thumb|Img 2: Value of Arsenic over time by location]] | ||
<br><br> | <br><br> | ||
| − | As observed in Img 2, even though there had been sharp increases and decreases in arsenic level over the years, as shown by the dotted trend line, arsenic value had on average been increasing over years. Arsenic value in Tansanee had spiked considerably as its value increased from 2.26 ug/L in 2011 to 4.468 ug/L in 2015. Despite the sharp increase in arsenic level, it is important to note that arsenic values are still way below US National Recommended Water Quality Criteria for aquatic life ambient | + | As observed in Img 2, even though there had been sharp increases and decreases in arsenic level over the years, as shown by the dotted trend line, arsenic value had on average been increasing over years. Arsenic value in Tansanee had spiked considerably as its value increased from 2.26 ug/L in 2011 to 4.468 ug/L in 2015. Despite the sharp increase in arsenic level, it is important to note that arsenic values are still way below US National Recommended Water Quality Criteria for aquatic life ambient. |
<br><br><br> | <br><br><br> | ||
<span style="font-size:16px; font-weight:bold;">2. Atrazine values had spiked during 2008 - 2010 for all waterway sensor sampled</span> | <span style="font-size:16px; font-weight:bold;">2. Atrazine values had spiked during 2008 - 2010 for all waterway sensor sampled</span> | ||
| Line 44: | Line 44: | ||
<br><br> | <br><br> | ||
| − | <span style="font-size:16px; font-weight:bold;">Comparison with a standardized water quality criteria</span | + | <span style="font-size:16px; font-weight:bold;">Comparison with a standardized water quality criteria</span> |
[[File:Comparison with US.png|thumb|Img 5: Comparison with Comparison with US National Recommended Water Quality Criteria]] | [[File:Comparison with US.png|thumb|Img 5: Comparison with Comparison with US National Recommended Water Quality Criteria]] | ||
| + | <br><br> | ||
| + | In Img 5, values that are above the US National Recommended Water Quality Criteria for aquatic life ambient are indicated in orange. As observed, there are 6 main measures that are above the criteria (Atrazine, Cadmium, Chromium, p,p-DDT, Sulfides and Zinc). Further analysis would be done to pinpoint the location/time where the criteria was exceeded | ||
<br><br> | <br><br> | ||
[[Assignments|<font face="Segoe UI Light" color="#3C33FF">Back to Assignments</font>]] | [[Assignments|<font face="Segoe UI Light" color="#3C33FF">Back to Assignments</font>]] | ||
Revision as of 01:54, 8 July 2018
VAST Mini Challenge 2: Findings
|
|
|
|
|
Q1: Characterize the past and most recent situation with respect to chemical contamination in the Boonsong Lekagul waterways.
Comparison across time
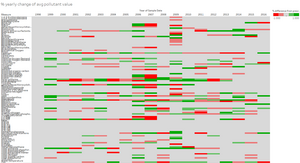
As observed in Img 1, there appears to be no obvious trends in terms of % yearly change of pollutants value. There is no consistent increase or decrease over the years as observed from the mix of red and green cells across the years. However, it appears there to be sharp increase and decrease in terms of pollutant values as observed from the bright green or red respectively. Further analysis is done for each pollutant that has sharp changes in recent years to understand the location that has contributed to these changes. The below mentioned trends had been observed
1. Increase in Arsenic values over the years
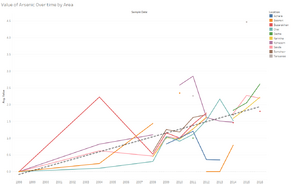
As observed in Img 2, even though there had been sharp increases and decreases in arsenic level over the years, as shown by the dotted trend line, arsenic value had on average been increasing over years. Arsenic value in Tansanee had spiked considerably as its value increased from 2.26 ug/L in 2011 to 4.468 ug/L in 2015. Despite the sharp increase in arsenic level, it is important to note that arsenic values are still way below US National Recommended Water Quality Criteria for aquatic life ambient.
2. Atrazine values had spiked during 2008 - 2010 for all waterway sensor sampled
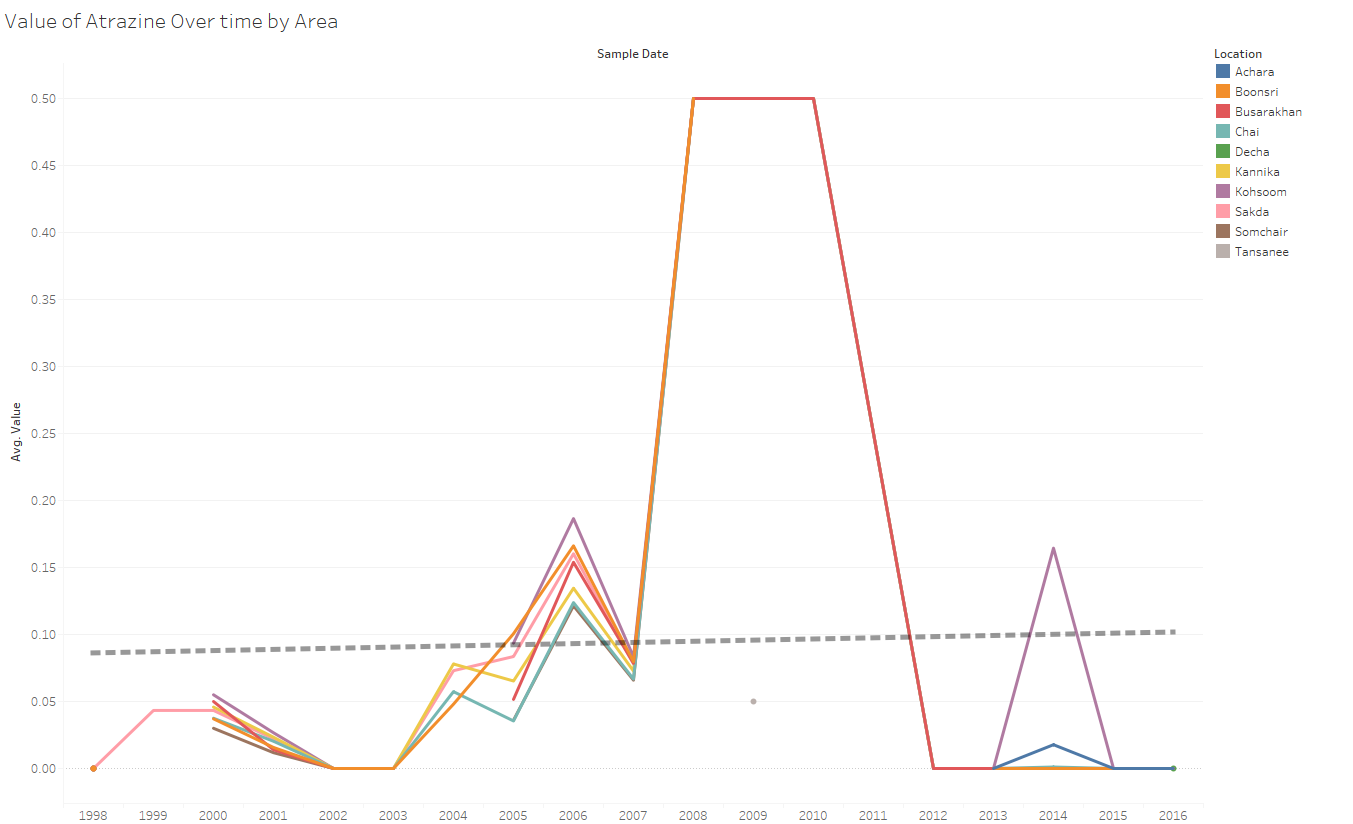
As observed in the above image, atrazine levels have consistently spiked across all the locations where readings are available from 2008 to 2010. This pattern seen across all the locations should be investigated further for the root cause.
3. Petroleum hydrocarbons values had spiked during 2012 for all waterway sensor sampled other than Boonsri
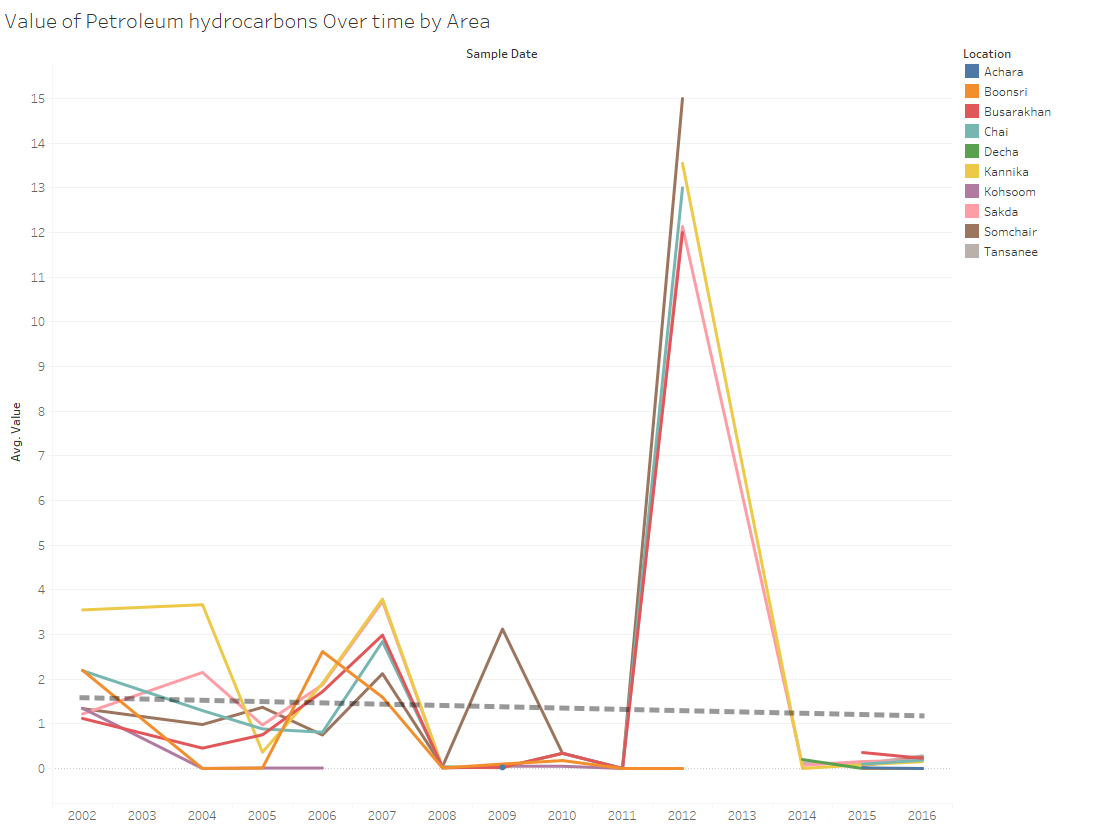
As observed in the above image, petroleum hydrocarbons levels have spiked across all the locations where readings are available, other than Boonsri in 2012. This pattern seen across all the locations should be investigated further for the root cause.
Comparison with a standardized water quality criteria
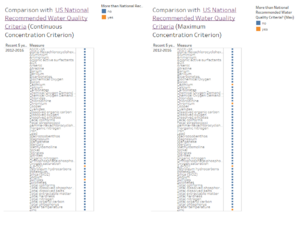
In Img 5, values that are above the US National Recommended Water Quality Criteria for aquatic life ambient are indicated in orange. As observed, there are 6 main measures that are above the criteria (Atrazine, Cadmium, Chromium, p,p-DDT, Sulfides and Zinc). Further analysis would be done to pinpoint the location/time where the criteria was exceeded
