Difference between revisions of "ISSS608 2017-18 T3 Assign Yeo Kaijun Findings"
Jump to navigation
Jump to search
| Line 22: | Line 22: | ||
<font size = 3; color="#FFFFFF"><span style="font-family:Century Gothic;">Q1: Characterize the past and most recent situation with respect to chemical contamination in the Boonsong Lekagul waterways.</span></font> | <font size = 3; color="#FFFFFF"><span style="font-family:Century Gothic;">Q1: Characterize the past and most recent situation with respect to chemical contamination in the Boonsong Lekagul waterways.</span></font> | ||
</div> | </div> | ||
| + | |||
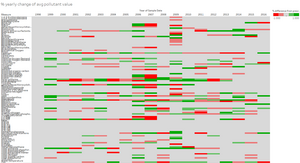
| + | [[File:Value of Pollutant over time.png|thumb|Img 1: % yearly change of pollutants value]] | ||
<br><br> | <br><br> | ||
| − | |||
| − | |||
<font face="Segoe UI Light" color="#000000"> As observed in Img 1, there appears to be no obvious trends in terms of % yearly change of pollutants value. There is no consistent increase or decrease over the years as observed from the mix of red and green cells across the years. However, it appears there to be sharp increase and decrease in terms of pollutant values as observed from the bright green or red respectively. Further analysis is done for each pollutant that has sharp changes in recent years (2015 & 2016) to understand the location that has contributed to these changes. | <font face="Segoe UI Light" color="#000000"> As observed in Img 1, there appears to be no obvious trends in terms of % yearly change of pollutants value. There is no consistent increase or decrease over the years as observed from the mix of red and green cells across the years. However, it appears there to be sharp increase and decrease in terms of pollutant values as observed from the bright green or red respectively. Further analysis is done for each pollutant that has sharp changes in recent years (2015 & 2016) to understand the location that has contributed to these changes. | ||
<br><br> | <br><br> | ||
[[Assignments|<font face="Segoe UI Light" color="#3C33FF">Back to Assignments</font>]] | [[Assignments|<font face="Segoe UI Light" color="#3C33FF">Back to Assignments</font>]] | ||
Revision as of 16:15, 7 July 2018
VAST Mini Challenge 2: Findings
|
|
|
|
|
Q1: Characterize the past and most recent situation with respect to chemical contamination in the Boonsong Lekagul waterways.
As observed in Img 1, there appears to be no obvious trends in terms of % yearly change of pollutants value. There is no consistent increase or decrease over the years as observed from the mix of red and green cells across the years. However, it appears there to be sharp increase and decrease in terms of pollutant values as observed from the bright green or red respectively. Further analysis is done for each pollutant that has sharp changes in recent years (2015 & 2016) to understand the location that has contributed to these changes.
