Difference between revisions of "ISSS608 2017-18 T3 Assign Kaushik Jaganathan - Insights and Conclusion"
| Line 1: | Line 1: | ||
| + | <font size="5"><font color="#42485D">'''Question 1'''</font></font><br/> | ||
| + | ''Characterize the past and most recent situation with respect to chemical contamination in the Boonsong Lekagul waterways. Do you see any trends of possible interest in this investigation?''<br/><br/> | ||
| + | |||
| + | <font size="5"><font color="#42485D">'''Question 2a'''</font></font><br/> | ||
| + | ''What anomalies do you find in the waterway samples dataset?''<br/><br/> | ||
| + | |||
| + | [[Image:ao_1.png|700px]]<br/> | ||
| + | |||
| + | Overall, considering all the chemicals, it is seen that Boonsri and Chai have had the maximum samples collected during 2005-2007. Also, Achara, Decha and Tansanee have samples only from 2009. Even though this image doesn’t give a very clear picture of what chemicals were sampled, it is at least noted that sampling was done regularly in Boonsri and Chai from 2005 to 2007. The samples have reduced recently when compared to that period in the image. | ||
| + | |||
| + | |||
| + | |||
| + | |||
<font size="5"><font color="#42485D">'''Question 3a'''</font></font><br/> | <font size="5"><font color="#42485D">'''Question 3a'''</font></font><br/> | ||
''After reviewing the data, do any of your findings cause particular concern for the Pipit or other wildlife?''<br/><br/> | ''After reviewing the data, do any of your findings cause particular concern for the Pipit or other wildlife?''<br/><br/> | ||
Revision as of 15:05, 7 July 2018
Question 1
Characterize the past and most recent situation with respect to chemical contamination in the Boonsong Lekagul waterways. Do you see any trends of possible interest in this investigation?
Question 2a
What anomalies do you find in the waterway samples dataset?
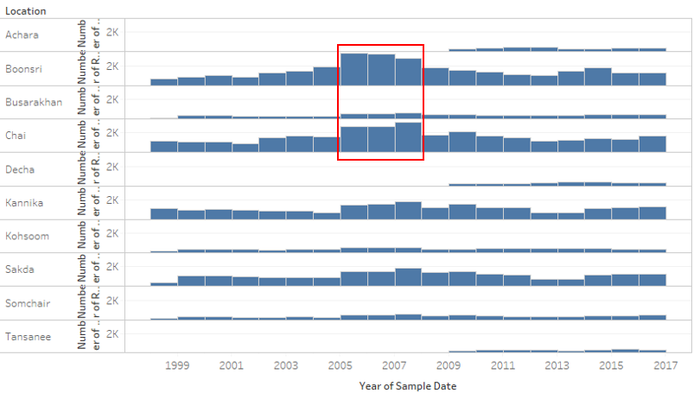
Overall, considering all the chemicals, it is seen that Boonsri and Chai have had the maximum samples collected during 2005-2007. Also, Achara, Decha and Tansanee have samples only from 2009. Even though this image doesn’t give a very clear picture of what chemicals were sampled, it is at least noted that sampling was done regularly in Boonsri and Chai from 2005 to 2007. The samples have reduced recently when compared to that period in the image.
Question 3a
After reviewing the data, do any of your findings cause particular concern for the Pipit or other wildlife?
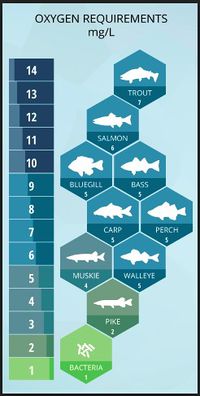
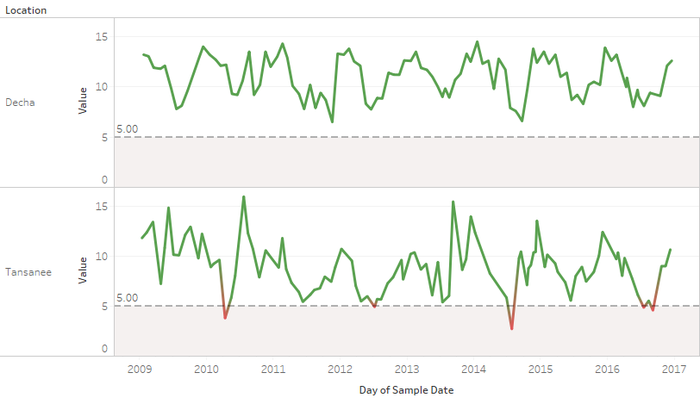
Dissolved oxygen is key to survival of aquatic life. Let’s have a look into DO patterns in the Reserve. The below image indicates that a level of atleast 5mg/L is required for most of the fish to survive.
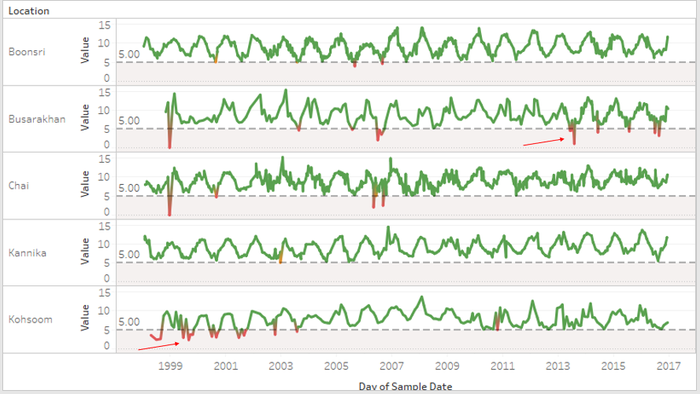
I have constructed a threshold at 5mg/L. DO levels above 5 are colored green and red when value falls below 5 and threatens aquatic life.
I have divided the locations into 4 streams and analysed the DO levels for all locations in a stream over time. In the above image, for locations in the stream 1 (Boonsri,Chai,Busarakhan,Kannika,Kohsoom), the DO levels at Busarakhan have been below threshold recently placing the aquatic species in danger. Kohsoom initially had low DO levels but in the recent years the levels are normal.
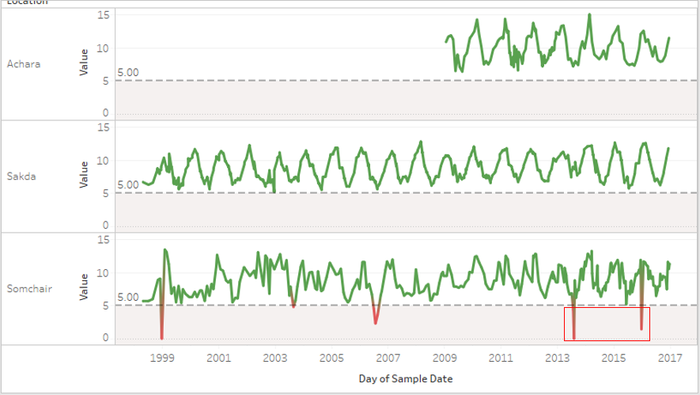
Let’s have a look at stream 2 (Somchair,Achara,Sakda)
Achara and sakda don’t have any anomalies while Somchair has had drop in DO levels in the recent years.
Looking at stream 3(Tansanee) & 4(Decha) indicate no alarming trends in DO.
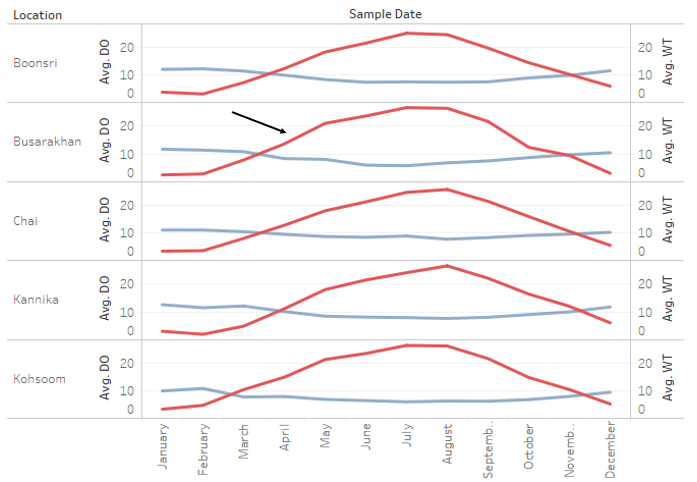
Also, An interesting relationship is observed between Water temperature and DO levels.
In the below visualisation, a dual axis chart is created for Average monthly Dissolved Oxygen level and Water temperature over the last 5 years. It is clearly seen that an inverse relationship exists between the 2 parameters.
For example, this relationship is studied for all locations in the stream 1 and it is seen that the trend is similar across all regions. Greater the area between the two lines, greater the effect on aquatic life as pointed out by the black arrow at Busarakhan.
