Difference between revisions of "ISSS608 2017-18 T3 Assign Kalai Selvi Data Preparation"
Kalaisr.2017 (talk | contribs) |
Kalaisr.2017 (talk | contribs) |
||
| Line 17: | Line 17: | ||
The Location data was imported into Tableau. Using the Background Image tab, Waterways Final.jpg image was imported. After editing the background image, X is dragged into Column shelf and Y is dragged into Rows shelf as shown below. | The Location data was imported into Tableau. Using the Background Image tab, Waterways Final.jpg image was imported. After editing the background image, X is dragged into Column shelf and Y is dragged into Rows shelf as shown below. | ||
| + | [[File:5.jpg|200 px]] | ||
Each location in the image is annotated as a point to find the (x,y) coordinate respectively. An example of the annotation for Boonsri is as below. After finding all the (x,y) coordinates for each location, the X and Y coordinates are updated in the Locations data. | Each location in the image is annotated as a point to find the (x,y) coordinate respectively. An example of the annotation for Boonsri is as below. After finding all the (x,y) coordinates for each location, the X and Y coordinates are updated in the Locations data. | ||
Revision as of 23:02, 6 July 2018
Contents
Check for Missing Records
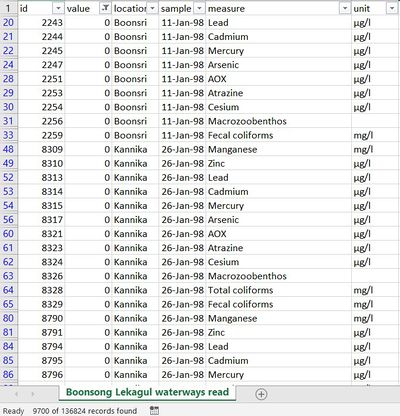
The Boonsong Lekagul waterways readings.csv data consists of the 5 fields: id, value, location, sample and measure. Vlookup function is used in the Boonsong Lekagul waterways readings to add the ‘unit’ from the chemical units of measure.csv data. Hence, now the waterway readings data now also consists of the unit field.
The Boonsong Lekagul waterways readings data was imported into JMP to check for missing records. There were 1,273 records with missing units and these are for the Macrozoobenthos chemical. Macrozoobenthos is a type of animal species and a unit of measurement is not required for this Macrozoobenthos measure.

Check for Chemical Measures with 0 values
There are 9,700 measures with 0 values. Records with 0 chemical reading value are deleted from the data as these are treated as incorrect entries. There were 127,124 records in the Final Boonsong Lekagul waterways readings after deleting the 9,700 records.
Create Locations.csv data and find x,y coordinates
A new excel file, Locations.csv is created and the fields are the Locations, X and Y coordinates.
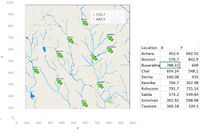
The Location data was imported into Tableau. Using the Background Image tab, Waterways Final.jpg image was imported. After editing the background image, X is dragged into Column shelf and Y is dragged into Rows shelf as shown below.
Each location in the image is annotated as a point to find the (x,y) coordinate respectively. An example of the annotation for Boonsri is as below. After finding all the (x,y) coordinates for each location, the X and Y coordinates are updated in the Locations data.
Join Tables
Boonsong Lekagul waterways readings.csv and Locations.csv data are imported into Tableau and joined using the common key, location in both datasets.

