Difference between revisions of "ISSS608 2016-17 T3 Assign GAURAV MIGLANI DataPrep"
Jump to navigation
Jump to search
Gauravm.2017 (talk | contribs) |
Gauravm.2017 (talk | contribs) |
||
| Line 23: | Line 23: | ||
| | | | ||
|} | |} | ||
| + | |||
| + | == Tools and Techniques Used== | ||
| + | 1. JMP | ||
| + | <br/> | ||
| + | 2. Tableau | ||
| + | <br/> | ||
| + | 3. Microsoft Excel | ||
| + | |||
| + | == Geospatial Data== | ||
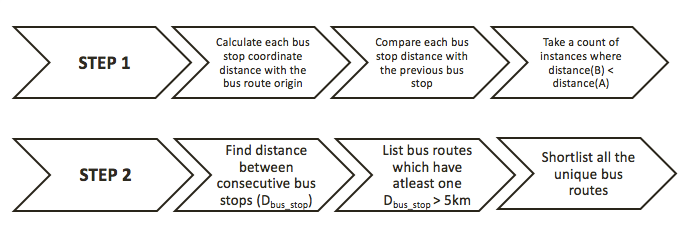
| + | We prepared the Geo-spatial data by creating two additional columns in the dataset that was provided to us for the VAST Challenge. The columns created represents the coordinates of each of the location that can be plotted on a 200x200 grid. The flow chart below shows the data preparation and methodology used for preparing geospatial visualisation. | ||
| + | |||
| + | [[Image:Flow.png|1700px|center]] | ||
Revision as of 09:18, 1 July 2018
 Mini Challenge 2:Like a Duck to Water
|
|
|
|
Tools and Techniques Used
1. JMP
2. Tableau
3. Microsoft Excel
Geospatial Data
We prepared the Geo-spatial data by creating two additional columns in the dataset that was provided to us for the VAST Challenge. The columns created represents the coordinates of each of the location that can be plotted on a 200x200 grid. The flow chart below shows the data preparation and methodology used for preparing geospatial visualisation.
