Difference between revisions of "Group27 Overview"
| Line 2: | Line 2: | ||
<!--ABSTRACT--> | <!--ABSTRACT--> | ||
<div style="vertical-align:bottom;"> | <div style="vertical-align:bottom;"> | ||
| − | <font size = 6><span style="font-family:Calibri Light;">Group 27: Airbnb's | + | <font size = 6><span style="font-family:Calibri Light;">Group 27: Airbnb's Impact on Affordable Housing in New York</span></font> |
</div> | </div> | ||
Revision as of 17:18, 17 June 2018
Group 27: Airbnb's Impact on Affordable Housing in New York
| Overview | Proposal | Poster | Application | Report |
ABSTRACT
Community groups and housing advocates in cities across the world have begun to sound the alarm about the impact Airbnb is having on affordable housing in their communities, citing concerns about housing supply lost, racialized gentrification, and impact on residents’ quality of life. To understand Airbnb’s impact on housing in New York, we aim at presents a comprehensive analysis of three years from 2015 to 2017 of Airbnb activity in New York City. It relies on the most comprehensive third-party dataset of Airbnb activity available, and methodologies of visualize and analysis geographical data.
Our report is motivated by the concerns increasingly raised by local communities and housing advocates that short-term rentals are clearly affect traditional residential rental housing and hotel accommodation. Either concern, if justified, would represent a serious problem for municipal authorities. But reliable, up-to-date evidence has been hard to come by. Accordingly, we aim at analysis different neighborhood’s distinct characteristics in New York, including significant seasonal tourism distributions, ethnic composition, price and density differences and set out to answer three main questions based on our analysis:
- How much housing has Airbnb removed from the market from the market in New York?
- How much Housing has Airbnb influenced household income?
|
|
OBJECTIVES
Airbnb Geospatial Pattern Analysis:
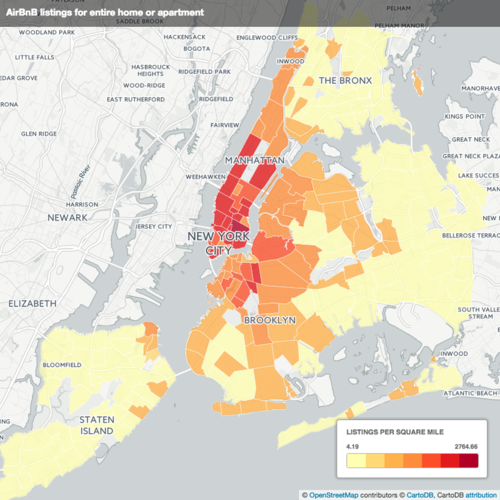
- Using geospatial analysis tools to map out the Airbnb property distribution in New York City across 5 boroughs from Year 2015 to 2017. We intend to visualize the sprawling pattern in New York City and dynamically changing density of listing Airbnb property in each neighbourhood.
- To refine the given broad geographic pattern, we turn to investigate the revenue-earning patterns in multiple neighbourhood derived from listing price and transaction records. The Airbnb revenue patterns would be compared with the gross rent income records across neighbourhood, which unveils the geographical rental gaps under two different “renting”form – Normal and Airbnb-ed.
Airbnb's Impact on Local Housing Market
After exploring the Airbnb activity in New York City, we tend to discover the impact on housing market, which leads to lower affordability housing, housing supply lost.
- We would line up the historical housing stocks in rental market and Airbnb property listing stock to simulate a group of shifting stock in two markets. In this way, we intend to estimate that how much of housing is removed from the rental market to become Airbnb-ed.
Additionally, we supplement with the vacancy units comparison across years to further justify our inference. Besides, the room type will be included to get further information as well.
- By introducing above revenue patterns, we will find out the motivation behind “Airbnb-ed”prevalence in rapidly sprawl neighborhood. We will set a threshold based on availability across a year to calssified host into “Professional”and “Part-time” to reveal which types of room owned by which type of host tends to achieve premium rental benefited from Airbnb.
- Citing the concerns about illegal renting, which is fewer than 30 days short term rental. We will take a look at the Airbnb activity during tourist season (e.g Summertime, Christmas & New Year) especially by comparing the Airbnb listing changes and availability during tourist season and normal time.
Then we will generate the revenue patterns for those property which only extremely activates during tourist season to assess the potential short term rental benefits leveraged by Airbnb. Meanwhile we will also highlight the number and ratio of illegal property during tourist season and the revenue made by these listings across different neighbourhood and multiple room types to sound the alarm of housing regulation.
DATASET
| Data | Format | Description | Source |
|---|---|---|---|
| Listing | csv | Summary information and metrics for listings in New York City. | http://insideairbnb.com/get-the-data.html |
| neighbourhoods | csv | Neighbourhood list for geo filter. Sourced from city or open source GIS files. | http://insideairbnb.com/get-the-data.html |
| calendar | csv | Detailed Calendar Data for listings in New York City. | http://insideairbnb.com/get-the-data.html |
| Selected Housing Characteristics | csv | Detailed Data for NYC's Occupied or Vacant, Own or Rent, Home Value. | https://factfinder.census.gov/faces/tableservices/jsf/pages/productview.xhtml?src=CF |
| Financial Characteristics | csv | Detailed Data for NYC's Household Income and Monthly Housing Costs. | https://factfinder.census.gov/faces/tableservices/jsf/pages/productview.xhtml?src=CF |
| Occupancy Characteristics | csv | Detailed Data for NYC's Household Size, Age of Householder, Family Type. | https://factfinder.census.gov/faces/tableservices/jsf/pages/productview.xhtml?src=CF |
TOOLS and PACKAGE
tidyverse: Consists of a set of R packages which are efficiently applicable for data wrangling and data visualization. Keeps data manipulation in a consistency of tidy approaches.
dplyr: Aims to provide a function for each basic verb of data manipulation.
maptools: Set of tools for manipulating and reading geographic data, in particular 'ESRI Shapefiles'.
shinyBS: Adds additional Twitter Bootstrap components to Shiny.
ggplot2: Based on the system for declaratively creating graphics, map variables to aesthetics
ggmap: A collection of functions to visualize spatial data and models on top of static maps from various online sources (e.g Google Maps and Stamen Maps)
REFERENCES
1. https://carto.com/blog/airbnb-impact/
3. http://www.wired.co.uk/article/airbnb-growth-london-housing-data-insideairbnb
4. https://threadreaderapp.com/thread/958390658481512449.html
5. http://www.sharebetter.org/wp-content/uploads/2018/01/High-Cost-Short-Term-Rentals.pdf

