|
|
| Line 688: |
Line 688: |
| | always'> | | always'> |
| | </span></b> | | </span></b> |
| − |
| |
| − | <h1>APPENDIX</h1>
| |
| − |
| |
| − | <p class=MsoNormal> </p>
| |
| − |
| |
| − | <h1>I. INSTALLATION GUIDE</h1>
| |
| − |
| |
| − | <p class=Default><span style='font-size:9.0pt;font-family:"Times",serif'>1.1
| |
| − | Data Preparation: </span></p>
| |
| − |
| |
| − | <p class=Default><span style='font-size:9.0pt;font-family:"Times",serif'> </span></p>
| |
| − |
| |
| − | <p class=Default style='margin-left:36.0pt;text-indent:-18.0pt'><span
| |
| − | style='font-size:9.0pt;font-family:Symbol'>·<span style='font:7.0pt "Times New Roman"'>
| |
| − | </span></span><span style='font-size:9.0pt;font-family:"Times",serif'>Datasets
| |
| − | for upload need to be in .csv format </span></p>
| |
| − |
| |
| − | <p class=Default style='margin-left:36.0pt;text-indent:-18.0pt'><span
| |
| − | style='font-size:9.0pt;font-family:Symbol'>·<span style='font:7.0pt "Times New Roman"'>
| |
| − | </span></span><span style='font-size:9.0pt;font-family:"Times",serif'>The
| |
| − | Dataset from GeBIZ needs to be in .csv format and saved in the data folder of
| |
| − | the Project under the name “government-procurement-via-gebiz.csv” </span></p>
| |
| − |
| |
| − | <p class=Default style='margin-left:36.0pt;text-indent:-18.0pt'><span
| |
| − | style='font-size:9.0pt;font-family:Symbol'>·<span style='font:7.0pt "Times New Roman"'>
| |
| − | </span></span><span style='font-size:9.0pt;font-family:"Times",serif'>Ensure
| |
| − | that the date column in the data is in the format: "yyyy-mm-dd” </span></p>
| |
| − |
| |
| − | <p class=Default><span style='font-size:9.0pt;font-family:"Times",serif'> </span></p>
| |
| − |
| |
| − | <p class=Default><span style='font-size:9.0pt;font-family:"Times",serif'>1.2
| |
| − | Online Use: </span></p>
| |
| − |
| |
| − | <p class=Default><span style='font-size:9.0pt;font-family:"Times",serif'> </span></p>
| |
| − |
| |
| − | <p class=Default><span style='font-size:9.0pt;font-family:"Times",serif'>The
| |
| − | recommended web browser would be Google Chrome for accessing our application
| |
| − | webpage. </span></p>
| |
| − |
| |
| − | <p class=Default style='text-indent:36.0pt'><span class=MsoHyperlink><span
| |
| − | style='font-size:9.0pt;font-family:"Times",serif'><a
| |
| − | href="https://isss608-2017-18-t3-group-17.shinyapps.io/ISSS_608_Group17_ShinyApp/">https://isss608-2017-18-t3-group-17.shinyapps.io/ISSS_608_Group17_ShinyApp/</a></span></span></p>
| |
| − |
| |
| − | <p class=Default><span style='font-size:9.0pt;font-family:"Times",serif'>Besides
| |
| − | that, no other special tools are required. </span></p>
| |
| − |
| |
| − | <p class=Default><span style='font-size:9.0pt;font-family:"Times",serif'> </span></p>
| |
| − |
| |
| − | <p class=Default><span style='font-size:9.0pt;font-family:"Times",serif'>1.3
| |
| − | Local Use: </span></p>
| |
| − |
| |
| − | <p class=Default><span style='font-size:9.0pt;font-family:"Times",serif'> </span></p>
| |
| − |
| |
| − | <p class=Default><span style='font-size:9.0pt;font-family:"Times",serif'>At the
| |
| − | point of the project, R version 3.4.1 and R Studio version 1.1.453 was used to
| |
| − | create the application. </span></p>
| |
| − |
| |
| − | <p class=Default><span style='font-size:9.0pt;font-family:"Times",serif'>1)
| |
| − | Install R Studio version 1.1.453 from: </span><span class=MsoHyperlink><span
| |
| − | style='font-size:9.0pt;font-family:"Times",serif'>https://www.rstudio.com/</span></span></p>
| |
| − |
| |
| − | <p class=MsoNormal>2) Download the project folder, unzip it and double click on
| |
| − | the R project “ISSS_608_Group17_ShinyApp”.</p>
| |
| − |
| |
| − | <p class=MsoNormal> </p>
| |
| − |
| |
| − | <p class=MsoNormal> </p>
| |
| − |
| |
| − | <p class=MsoNormal align=center style='text-align:center'><img border=0
| |
| − | width=519 height=276 id="Picture 246"
| |
| − | src="ISSS608_VA_Group17_Paper_Wiki_files/image020.jpg"></p>
| |
| − |
| |
| − | <p class=MsoNormal> </p>
| |
| − |
| |
| − | <p class=MsoNormal>3) Click on the Run App button to run the Application.</p>
| |
| − |
| |
| − | <p class=MsoNormal> </p>
| |
| − |
| |
| − | <p class=MsoNormal> </p>
| |
| − |
| |
| − | <p class=MsoNormal> </p>
| |
| − |
| |
| − | <p class=MsoNormal> </p>
| |
| − |
| |
| − | <p class=MsoNormal> </p>
| |
| − |
| |
| − | <p class=MsoNormal> </p>
| |
| − |
| |
| − | <p class=MsoNormal> </p>
| |
| − |
| |
| − | <p class=MsoNormal> </p>
| |
| − |
| |
| − | <p class=MsoNormal> </p>
| |
| − |
| |
| − | <p class=MsoNormal> </p>
| |
| − |
| |
| − | <p class=MsoNormal> </p>
| |
| − |
| |
| − | <p class=MsoNormal> </p>
| |
| − |
| |
| − | <p class=MsoNormal> </p>
| |
| − |
| |
| − | <p class=MsoNormal> </p>
| |
| − |
| |
| − | <p class=MsoNormal> </p>
| |
| − |
| |
| − | <p class=MsoNormal> </p>
| |
| − |
| |
| − | <p class=ReferenceTitle> </p>
| |
| − |
| |
| − | <h1>II. USER GUIDE</h1>
| |
| − |
| |
| − | </div>
| |
| − |
| |
| − | <b><span style='font-size:9.0pt;font-family:"Helvetica",sans-serif;font-variant:
| |
| − | small-caps;letter-spacing:.65pt'><br clear=all style='page-break-before:auto'>
| |
| − | </span></b>
| |
| − |
| |
| − | <div class=WordSection7>
| |
| − |
| |
| − | <p class=MsoNormal> </p>
| |
| − |
| |
| − | <p class=MsoNormal>When you launch the App, the first screen that welcomes you
| |
| − | will be:</p>
| |
| − |
| |
| − | <p class=MsoNormal> </p>
| |
| − |
| |
| − | <p class=MsoNormal align=center style='text-align:center'><img border=0
| |
| − | width=576 height=290 src="ISSS608_VA_Group17_Paper_Wiki_files/image021.jpg"
| |
| − | alt=1></p>
| |
| − |
| |
| − | <p class=MsoNormal>The App has 5 main sections. Each section has its own
| |
| − | subsections where required. The Layout is as shown.</p>
| |
| − |
| |
| − | <p class=MsoNormal> </p>
| |
| − |
| |
| − | <p class=MsoListParagraphCxSpFirst style='margin-left:18.0pt;text-indent:-18.0pt'><span
| |
| − | lang=EN-US style='font-size:9.0pt'>1.<span style='font:7.0pt "Times New Roman"'>
| |
| − | </span></span><span lang=EN-US style='font-size:9.0pt'>Overview</span></p>
| |
| − |
| |
| − | <p class=MsoListParagraphCxSpMiddle style='margin-left:39.6pt;text-indent:-21.6pt'><span
| |
| − | lang=EN-US style='font-size:9.0pt'>1.1.<span style='font:7.0pt "Times New Roman"'>
| |
| − | </span></span><span lang=EN-US style='font-size:9.0pt'>About the Project</span></p>
| |
| − |
| |
| − | <p class=MsoListParagraphCxSpMiddle style='margin-left:18.0pt;text-indent:-18.0pt'><span
| |
| − | lang=EN-US style='font-size:9.0pt'>2.<span style='font:7.0pt "Times New Roman"'>
| |
| − | </span></span><span lang=EN-US style='font-size:9.0pt'>Import Data</span></p>
| |
| − |
| |
| − | <p class=MsoListParagraphCxSpMiddle style='margin-left:39.6pt;text-indent:-21.6pt'><span
| |
| − | lang=EN-US style='font-size:9.0pt'>2.1.<span style='font:7.0pt "Times New Roman"'>
| |
| − | </span></span><span lang=EN-US style='font-size:9.0pt'>Select Data for Analysis</span></p>
| |
| − |
| |
| − | <p class=MsoListParagraphCxSpMiddle style='margin-left:39.6pt;text-indent:-21.6pt'><span
| |
| − | lang=EN-US style='font-size:9.0pt'>2.2.<span style='font:7.0pt "Times New Roman"'>
| |
| − | </span></span><span lang=EN-US style='font-size:9.0pt'>Validate Data</span></p>
| |
| − |
| |
| − | <p class=MsoListParagraphCxSpMiddle style='margin-left:18.0pt;text-indent:-18.0pt'><span
| |
| − | lang=EN-US style='font-size:9.0pt'>3.<span style='font:7.0pt "Times New Roman"'>
| |
| − | </span></span><span lang=EN-US style='font-size:9.0pt'>Data Visualization</span></p>
| |
| − |
| |
| − | <p class=MsoListParagraphCxSpMiddle style='margin-left:39.6pt;text-indent:-21.6pt'><span
| |
| − | lang=EN-US style='font-size:9.0pt'>3.1.<span style='font:7.0pt "Times New Roman"'>
| |
| − | </span></span><span lang=EN-US style='font-size:9.0pt'>Procurement Expenses</span></p>
| |
| − |
| |
| − | <p class=MsoListParagraphCxSpMiddle style='margin-left:39.6pt;text-indent:-21.6pt'><span
| |
| − | lang=EN-US style='font-size:9.0pt'>3.2.<span style='font:7.0pt "Times New Roman"'>
| |
| − | </span></span><span lang=EN-US style='font-size:9.0pt'>Ministry and Suppliers</span></p>
| |
| − |
| |
| − | <p class=MsoListParagraphCxSpMiddle style='margin-left:39.6pt;text-indent:-21.6pt'><span
| |
| − | lang=EN-US style='font-size:9.0pt'>3.3.<span style='font:7.0pt "Times New Roman"'>
| |
| − | </span></span><span lang=EN-US style='font-size:9.0pt'>Order patterns</span></p>
| |
| − |
| |
| − | <p class=MsoListParagraphCxSpMiddle style='margin-left:39.6pt;text-indent:-21.6pt'><span
| |
| − | lang=EN-US style='font-size:9.0pt'>3.4.<span style='font:7.0pt "Times New Roman"'>
| |
| − | </span></span><span lang=EN-US style='font-size:9.0pt'>Topic Modeling</span></p>
| |
| − |
| |
| − | <p class=MsoListParagraphCxSpMiddle style='margin-left:18.0pt;text-indent:-18.0pt'><span
| |
| − | lang=EN-US style='font-size:9.0pt'>4.<span style='font:7.0pt "Times New Roman"'>
| |
| − | </span></span><span lang=EN-US style='font-size:9.0pt'>Association
| |
| − | Visualization</span></p>
| |
| − |
| |
| − | <p class=MsoListParagraphCxSpMiddle style='margin-left:39.6pt;text-indent:-21.6pt'><span
| |
| − | lang=EN-US style='font-size:9.0pt'>4.1.<span style='font:7.0pt "Times New Roman"'>
| |
| − | </span></span><span lang=EN-US style='font-size:9.0pt'>Overview</span></p>
| |
| − |
| |
| − | <p class=MsoListParagraphCxSpMiddle style='margin-left:39.6pt;text-indent:-21.6pt'><span
| |
| − | lang=EN-US style='font-size:9.0pt'>4.2.<span style='font:7.0pt "Times New Roman"'>
| |
| − | </span></span><span lang=EN-US style='font-size:9.0pt'>Supplier Networks</span></p>
| |
| − |
| |
| − | <p class=MsoListParagraphCxSpLast style='margin-left:18.0pt;text-indent:-18.0pt'><span
| |
| − | lang=EN-US style='font-size:9.0pt'>5.<span style='font:7.0pt "Times New Roman"'>
| |
| − | </span></span><span lang=EN-US style='font-size:9.0pt'>View and Export Data</span></p>
| |
| − |
| |
| − | <p class=MsoNormal> </p>
| |
| − |
| |
| − | <p class=MsoSubtitle style='margin-left:36.0pt;text-indent:-18.0pt'><span
| |
| − | lang=EN-US style='font-size:9.0pt;line-height:107%;font-family:"Times",serif'>1.<span
| |
| − | style='font:7.0pt "Times New Roman"'> </span></span><span
| |
| − | lang=EN-US style='font-size:9.0pt;line-height:107%;font-family:"Times",serif'>Overview
| |
| − | Page</span></p>
| |
| − |
| |
| − | <p class=MsoNormal>This page gives a brief introduction to what we are doing in
| |
| − | this project.</p>
| |
| − |
| |
| − | <p class=MsoNormal>While we can navigate to different tabs directly from the
| |
| − | overview page (As we have incorporated default data), it is recommended that we
| |
| − | move to the Import Data page.</p>
| |
| − |
| |
| − | <p class=MsoNormal> </p>
| |
| − |
| |
| − | <p class=MsoSubtitle style='margin-left:36.0pt;text-indent:-18.0pt'><span
| |
| − | lang=EN-US style='font-size:9.0pt;line-height:107%;font-family:"Times",serif'>2.<span
| |
| − | style='font:7.0pt "Times New Roman"'> </span></span><span
| |
| − | lang=EN-US style='font-size:9.0pt;line-height:107%;font-family:"Times",serif'>Import
| |
| − | Data</span></p>
| |
| − |
| |
| − | <p class=MsoSubtitle><span lang=EN-US style='font-size:9.0pt;line-height:107%;
| |
| − | font-family:"Times",serif'>2.1 Select Data for Analysis</span></p>
| |
| − |
| |
| − | <p class=MsoNormal align=center style='text-align:center'><img border=0
| |
| − | width=602 height=197 id="Picture 2"
| |
| − | src="ISSS608_VA_Group17_Paper_Wiki_files/image022.jpg"></p>
| |
| − |
| |
| − | <p class=MsoNormal>In this page, we decide which dataset to use in our
| |
| − | analysis. We have 2 options here.</p>
| |
| − |
| |
| − | <p class=MsoListParagraphCxSpFirst style='text-indent:-18.0pt'><span
| |
| − | lang=EN-US style='font-size:9.0pt;font-family:Symbol'>·<span style='font:7.0pt "Times New Roman"'>
| |
| − | </span></span><span lang=EN-US style='font-size:9.0pt'>Use the Default Data
| |
| − | (Data that was used for building the app)</span></p>
| |
| − |
| |
| − | <p class=MsoListParagraphCxSpMiddle style='margin-left:72.0pt;text-indent:-18.0pt'><span
| |
| − | lang=EN-US style='font-size:9.0pt;font-family:"Courier New"'>o<span
| |
| − | style='font:7.0pt "Times New Roman"'> </span></span><span
| |
| − | lang=EN-US style='font-size:9.0pt'>Suppose we decide to use the Default data
| |
| − | source, you can proceed to click the “next” button to navigate to the Validate
| |
| − | data section</span></p>
| |
| − |
| |
| − | <p class=MsoListParagraphCxSpMiddle style='text-indent:-18.0pt'><span
| |
| − | class=MsoHyperlink><span lang=EN-US style='font-size:9.0pt;font-family:Symbol;
| |
| − | color:windowtext;text-decoration:none'>·<span style='font:7.0pt "Times New Roman"'>
| |
| − | </span></span></span><span lang=EN-US style='font-size:9.0pt'>Use an updated
| |
| − | version of the dataset downloaded from </span><span class=MsoHyperlink><span
| |
| − | style='font-size:9.0pt'><a href="https://data.gov.sg/dataset?q=GeBIZ">https://data.gov.sg/dataset?q=GeBIZ</a></span></span></p>
| |
| − |
| |
| − | <p class=MsoListParagraphCxSpLast style='margin-left:72.0pt;text-indent:-18.0pt'><span
| |
| − | lang=EN-US style='font-size:9.0pt;font-family:"Courier New"'>o<span
| |
| − | style='font:7.0pt "Times New Roman"'> </span></span><span
| |
| − | lang=EN-US style='font-size:9.0pt'>In case we want to use a new data source,
| |
| − | select the “New Data Source” radio button. A new menu will become visible.</span></p>
| |
| − |
| |
| − | <p class=MsoNormal align=center style='text-align:center'><img border=0
| |
| − | width=497 height=265 id="Picture 3"
| |
| − | src="ISSS608_VA_Group17_Paper_Wiki_files/image023.jpg"></p>
| |
| − |
| |
| − | <p class=MsoListParagraphCxSpFirst style='margin-left:72.0pt;text-indent:-18.0pt'><span
| |
| − | lang=EN-US style='font-size:9.0pt;font-family:"Courier New"'>o<span
| |
| − | style='font:7.0pt "Times New Roman"'> </span></span><span
| |
| − | lang=EN-US style='font-size:9.0pt'>In the menu, click on “Browse” button and
| |
| − | use the resulting screen to navigate to and select the updated data saved
| |
| − | locally in your PC.</span></p>
| |
| − |
| |
| − | <p class=MsoListParagraphCxSpMiddle style='margin-left:72.0pt;text-indent:-18.0pt'><span
| |
| − | lang=EN-US style='font-size:9.0pt;font-family:"Courier New"'>o<span
| |
| − | style='font:7.0pt "Times New Roman"'> </span></span><span
| |
| − | lang=EN-US style='font-size:9.0pt'>Once it is selected, the app loads it and
| |
| − | shows a preview of how it appears. You can use the options to adjust the import
| |
| − | until it looks as shown above.</span></p>
| |
| − |
| |
| − | <p class=MsoListParagraphCxSpMiddle style='margin-left:108.0pt;text-indent:
| |
| − | -18.0pt'><span lang=EN-US style='font-size:9.0pt;font-family:Wingdings'>§<span
| |
| − | style='font:7.0pt "Times New Roman"'> </span></span><span lang=EN-US
| |
| − | style='font-size:9.0pt'>Header: Specify whether the dataset contains a header
| |
| − | column. (Ideally it should have one.)</span></p>
| |
| − |
| |
| − | <p class=MsoListParagraphCxSpMiddle style='margin-left:108.0pt;text-indent:
| |
| − | -18.0pt'><span lang=EN-US style='font-size:9.0pt;font-family:Wingdings'>§<span
| |
| − | style='font:7.0pt "Times New Roman"'> </span></span><span lang=EN-US
| |
| − | style='font-size:9.0pt'>Separator: Specify what is the separator in CSV file. </span></p>
| |
| − |
| |
| − | <p class=MsoListParagraphCxSpMiddle style='margin-left:108.0pt;text-indent:
| |
| − | -18.0pt'><span lang=EN-US style='font-size:9.0pt;font-family:Wingdings'>§<span
| |
| − | style='font:7.0pt "Times New Roman"'> </span></span><span lang=EN-US
| |
| − | style='font-size:9.0pt'>Quote: Specify the format of quotes in the data.</span></p>
| |
| − |
| |
| − | <p class=MsoListParagraphCxSpMiddle style='margin-left:72.0pt;text-indent:-18.0pt'><span
| |
| − | lang=EN-US style='font-size:9.0pt;font-family:"Courier New"'>o<span
| |
| − | style='font:7.0pt "Times New Roman"'> </span></span><span
| |
| − | lang=EN-US style='font-size:9.0pt'>Overwrite Default Data: This option allows
| |
| − | you to overwrite the default data with the data you have currently loaded.</span></p>
| |
| − |
| |
| − | <p class=MsoListParagraphCxSpLast style='margin-left:72.0pt;text-indent:-18.0pt'><span
| |
| − | lang=EN-US style='font-size:9.0pt;font-family:"Courier New"'>o<span
| |
| − | style='font:7.0pt "Times New Roman"'> </span></span><span
| |
| − | lang=EN-US style='font-size:9.0pt'>Once the data looks okay, click on the
| |
| − | “next” button to navigate to the next page.</span></p>
| |
| − |
| |
| − | <p class=MsoNormal><span lang=EN-US> </span></p>
| |
| − |
| |
| − | <p class=MsoNormal><span lang=EN-US> </span></p>
| |
| − |
| |
| − | <p class=MsoSubtitle style='margin-left:36.0pt;text-indent:-18.0pt'><span
| |
| − | lang=EN-US style='font-size:9.0pt;line-height:107%;font-family:"Times",serif'>2.2<span
| |
| − | style='font:7.0pt "Times New Roman"'> </span></span><span lang=EN-US
| |
| − | style='font-size:9.0pt;line-height:107%;font-family:"Times",serif'>Validate
| |
| − | Data</span></p>
| |
| − |
| |
| − | <p class=MsoNormal align=center style='text-align:center'><img border=0
| |
| − | width=602 height=200 id="Picture 4"
| |
| − | src="ISSS608_VA_Group17_Paper_Wiki_files/image024.jpg"></p>
| |
| − |
| |
| − | <p class=MsoListParagraphCxSpFirst><span lang=EN-US style='font-size:9.0pt'>This
| |
| − | page shows you if here were any agencies in your data, that was not able to be
| |
| − | mapped onto ministries. You will have to manually find the ministries for these
| |
| − | agencies and update the “MinistryReference.csv” file.</span></p>
| |
| − |
| |
| − | <p class=MsoListParagraphCxSpMiddle><span lang=EN-US style='font-size:9.0pt'>If
| |
| − | the data looks proper, we can navigate to the Procurement Expenses page in the
| |
| − | Data Visualizations tab using the button “Proceed to Visualizations”.</span></p>
| |
| − |
| |
| − | <p class=MsoListParagraphCxSpLast><span lang=EN-US style='font-size:9.0pt'> </span></p>
| |
| − |
| |
| − | <p class=MsoSubtitle style='margin-left:36.0pt;text-indent:-18.0pt'><span
| |
| − | lang=EN-US style='font-size:9.0pt;line-height:107%;font-family:"Times",serif'>3.<span
| |
| − | style='font:7.0pt "Times New Roman"'> </span></span><span
| |
| − | lang=EN-US style='font-size:9.0pt;line-height:107%;font-family:"Times",serif'>Data
| |
| − | visualization</span></p>
| |
| − |
| |
| − | <p class=MsoSubtitle align=center style='text-align:center'><span lang=EN-US
| |
| − | style='font-size:9.0pt;line-height:107%;font-family:"Times",serif'><img
| |
| − | border=0 width=545 height=290 id="Picture 5"
| |
| − | src="ISSS608_VA_Group17_Paper_Wiki_files/image025.jpg"></span></p>
| |
| − |
| |
| − | <p class=MsoSubtitle style='margin-left:36.0pt;text-indent:-18.0pt'><span
| |
| − | lang=EN-US style='font-size:9.0pt;line-height:107%;font-family:"Times",serif'>3.2<span
| |
| − | style='font:7.0pt "Times New Roman"'> </span></span><span lang=EN-US
| |
| − | style='font-size:9.0pt;line-height:107%;font-family:"Times",serif'>Procurement
| |
| − | Expenses</span></p>
| |
| − |
| |
| − | <p class=MsoNormal>The section has the procurement related expenses visualized
| |
| − | in Tree map as well as Sankey format. The visualizations are under 2 sections</p>
| |
| − |
| |
| − | <p class=MsoListParagraphCxSpFirst style='text-indent:-18.0pt'><span
| |
| − | lang=EN-US style='font-size:9.0pt;font-family:Symbol'>·<span style='font:7.0pt "Times New Roman"'>
| |
| − | </span></span><span lang=EN-US style='font-size:9.0pt'>Amount Spent by
| |
| − | Different Ministries</span></p>
| |
| − |
| |
| − | <p class=MsoListParagraphCxSpMiddle style='margin-left:72.0pt;text-indent:-18.0pt'><span
| |
| − | lang=EN-US style='font-size:9.0pt;font-family:"Courier New"'>o<span
| |
| − | style='font:7.0pt "Times New Roman"'> </span></span><span
| |
| − | lang=EN-US style='font-size:9.0pt'>Default View is the Color Based on Ministry</span></p>
| |
| − |
| |
| − | <p class=MsoListParagraphCxSpMiddle align=center style='text-align:center'><span
| |
| − | lang=EN-US style='font-size:9.0pt'><img border=0 width=524 height=219
| |
| − | id="Picture 9" src="ISSS608_VA_Group17_Paper_Wiki_files/image026.jpg"></span></p>
| |
| − |
| |
| − | <p class=MsoListParagraphCxSpMiddle><span lang=EN-US style='font-size:9.0pt'> </span></p>
| |
| − |
| |
| − | <p class=MsoListParagraphCxSpMiddle style='margin-left:72.0pt;text-indent:-18.0pt'><span
| |
| − | lang=EN-US style='font-size:9.0pt;font-family:"Courier New"'>o<span
| |
| − | style='font:7.0pt "Times New Roman"'> </span></span><span
| |
| − | lang=EN-US style='font-size:9.0pt'>If you Hover over the tiles, the underlying
| |
| − | Agency level tiles are visible. If you click on a tile you can zoom in. by
| |
| − | clicking on the title, E.g.: “Government.MSF”, you can navigate back to the
| |
| − | normal view. </span></p>
| |
| − |
| |
| − | <p class=MsoListParagraphCxSpMiddle align=center style='text-align:center'><span
| |
| − | lang=EN-US style='font-size:9.0pt'><img border=0 width=503 height=217
| |
| − | id="Picture 10" src="ISSS608_VA_Group17_Paper_Wiki_files/image027.jpg"></span></p>
| |
| − |
| |
| − | <p class=MsoListParagraphCxSpMiddle style='margin-left:72.0pt;text-indent:-18.0pt'><span
| |
| − | lang=EN-US style='font-size:9.0pt;font-family:"Courier New"'>o<span
| |
| − | style='font:7.0pt "Times New Roman"'> </span></span><span
| |
| − | lang=EN-US style='font-size:9.0pt'>If you want to see all the agency level
| |
| − | tiles at the same time, click on “Color based on Agency”. </span></p>
| |
| − |
| |
| − | <p class=MsoListParagraphCxSpMiddle align=center style='text-align:center'><span
| |
| − | lang=EN-US style='font-size:9.0pt'><img border=0 width=502 height=218
| |
| − | id="Picture 11" src="ISSS608_VA_Group17_Paper_Wiki_files/image028.jpg"></span></p>
| |
| − |
| |
| − | <p class=MsoListParagraphCxSpMiddle style='margin-left:72.0pt;text-indent:-18.0pt'><span
| |
| − | lang=EN-US style='font-size:9.0pt;font-family:"Courier New"'>o<span
| |
| − | style='font:7.0pt "Times New Roman"'> </span></span><span
| |
| − | lang=EN-US style='font-size:9.0pt'>If you click on “Show Ministry to
| |
| − | Abbreviation Mapping”, you can get a pop up screen which shows you the Ministry
| |
| − | names and their corresponding abbreviations. </span></p>
| |
| − |
| |
| − | <p class=MsoListParagraphCxSpMiddle align=center style='text-align:center'><span
| |
| − | lang=EN-US style='font-size:9.0pt'><img border=0 width=327 height=416
| |
| − | id="Picture 12" src="ISSS608_VA_Group17_Paper_Wiki_files/image029.jpg"></span></p>
| |
| − |
| |
| − | <p class=MsoListParagraphCxSpMiddle><span lang=EN-US style='font-size:9.0pt'> </span></p>
| |
| − |
| |
| − | <p class=MsoListParagraphCxSpMiddle style='text-indent:-18.0pt'><span
| |
| − | lang=EN-US style='font-size:9.0pt;font-family:Symbol'>·<span style='font:7.0pt "Times New Roman"'>
| |
| − | </span></span><span lang=EN-US style='font-size:9.0pt'>Procurements at Individual
| |
| − | Ministry Level</span></p>
| |
| − |
| |
| − | <p class=MsoListParagraphCxSpMiddle style='margin-left:72.0pt;text-indent:-18.0pt'><span
| |
| − | lang=EN-US style='font-size:9.0pt;font-family:"Courier New"'>o<span
| |
| − | style='font:7.0pt "Times New Roman"'> </span></span><span
| |
| − | lang=EN-US style='font-size:9.0pt'>Here, we visualize the flow of cash and
| |
| − | number of orders using a Sankey diagram. The controls given help determine the
| |
| − | view.</span></p>
| |
| − |
| |
| − | <p class=MsoListParagraphCxSpMiddle style='margin-left:72.0pt;text-indent:-18.0pt'><span
| |
| − | lang=EN-US style='font-size:9.0pt;font-family:"Courier New"'>o<span
| |
| − | style='font:7.0pt "Times New Roman"'> </span></span><span
| |
| − | lang=EN-US style='font-size:9.0pt'>By default, it is set to Top N Supplier and
| |
| − | Top n Agency and to show the expense amount.</span></p>
| |
| − |
| |
| − | <p class=MsoListParagraphCxSpMiddle style='margin-left:108.0pt;text-indent:
| |
| − | -18.0pt'><span lang=EN-US style='font-size:9.0pt;font-family:Wingdings'>§<span
| |
| − | style='font:7.0pt "Times New Roman"'> </span></span><span lang=EN-US
| |
| − | style='font-size:9.0pt'>We can select a single ministry.</span></p>
| |
| − |
| |
| − | <p class=MsoListParagraphCxSpMiddle style='margin-left:108.0pt;text-indent:
| |
| − | -18.0pt'><span lang=EN-US style='font-size:9.0pt;font-family:Wingdings'>§<span
| |
| − | style='font:7.0pt "Times New Roman"'> </span></span><span lang=EN-US
| |
| − | style='font-size:9.0pt'>We can select the up to Nth top agency to view</span></p>
| |
| − |
| |
| − | <p class=MsoListParagraphCxSpMiddle style='margin-left:108.0pt;text-indent:
| |
| − | -18.0pt'><span lang=EN-US style='font-size:9.0pt;font-family:Wingdings'>§<span
| |
| − | style='font:7.0pt "Times New Roman"'> </span></span><span lang=EN-US
| |
| − | style='font-size:9.0pt'>We can select the up to Nth top supplier to view</span></p>
| |
| − |
| |
| − | <p class=MsoListParagraphCxSpMiddle align=center style='text-align:center'><span
| |
| − | lang=EN-US style='font-size:9.0pt'><img border=0 width=385 height=235
| |
| − | id="Picture 17" src="ISSS608_VA_Group17_Paper_Wiki_files/image030.jpg"></span></p>
| |
| − |
| |
| − | <p class=MsoListParagraphCxSpMiddle align=center style='text-align:center'><span
| |
| − | lang=EN-US style='font-size:9.0pt'><img border=0 width=397 height=242
| |
| − | id="Picture 18" src="ISSS608_VA_Group17_Paper_Wiki_files/image031.jpg"></span></p>
| |
| − |
| |
| − | <p class=MsoListParagraphCxSpMiddle style='margin-left:72.0pt;text-indent:-18.0pt'><span
| |
| − | lang=EN-US style='font-size:9.0pt;font-family:"Courier New"'>o<span
| |
| − | style='font:7.0pt "Times New Roman"'> </span></span><span
| |
| − | lang=EN-US style='font-size:9.0pt'>We can also choose to visualize by specific
| |
| − | Ministry and Agency.</span></p>
| |
| − |
| |
| − | <p class=MsoListParagraphCxSpMiddle style='margin-left:108.0pt;text-indent:
| |
| − | -18.0pt'><span lang=EN-US style='font-size:9.0pt;font-family:Wingdings'>§<span
| |
| − | style='font:7.0pt "Times New Roman"'> </span></span><span lang=EN-US
| |
| − | style='font-size:9.0pt'>We can select the ministry</span></p>
| |
| − |
| |
| − | <p class=MsoListParagraphCxSpMiddle style='margin-left:108.0pt;text-indent:
| |
| − | -18.0pt'><span lang=EN-US style='font-size:9.0pt;font-family:Wingdings'>§<span
| |
| − | style='font:7.0pt "Times New Roman"'> </span></span><span lang=EN-US
| |
| − | style='font-size:9.0pt'>We can select the agency</span></p>
| |
| − |
| |
| − | <p class=MsoListParagraphCxSpMiddle align=center style='text-align:center'><span
| |
| − | lang=EN-US style='font-size:9.0pt'><img border=0 width=381 height=249
| |
| − | id="Picture 19" src="ISSS608_VA_Group17_Paper_Wiki_files/image032.jpg"></span></p>
| |
| − |
| |
| − | <p class=MsoListParagraphCxSpLast align=center style='text-align:center'><span
| |
| − | lang=EN-US style='font-size:9.0pt'><img border=0 width=381 height=244
| |
| − | id="Picture 20" src="ISSS608_VA_Group17_Paper_Wiki_files/image033.jpg"></span></p>
| |
| − |
| |
| − | <p class=MsoSubtitle style='margin-left:39.6pt;text-indent:-21.6pt'><span
| |
| − | lang=EN-US style='font-size:9.0pt;line-height:107%;font-family:"Times",serif'>1.1.<span
| |
| − | style='font:7.0pt "Times New Roman"'> </span></span><span lang=EN-US
| |
| − | style='font-size:9.0pt;line-height:107%;font-family:"Times",serif'>Ministry and
| |
| − | Suppliers</span></p>
| |
| − |
| |
| − | <p class=MsoNormal align=center style='text-align:center'><img border=0
| |
| − | width=525 height=279 id="Picture 27"
| |
| − | src="ISSS608_VA_Group17_Paper_Wiki_files/image034.jpg"></p>
| |
| − |
| |
| − | <p class=MsoNormal>In this screen we have 2 visualizations. They are,</p>
| |
| − |
| |
| − | <p class=MsoListParagraphCxSpFirst style='text-indent:-18.0pt'><span
| |
| − | style='font-size:9.0pt;font-family:Symbol'>·<span style='font:7.0pt "Times New Roman"'>
| |
| − | </span></span><span style='font-size:9.0pt'>Count of Transactions by type of
| |
| − | Tender</span></p>
| |
| − |
| |
| − | <p class=MsoListParagraphCxSpMiddle align=center style='margin-left:72.0pt;
| |
| − | text-align:center;text-indent:-18.0pt'><span style='font-size:9.0pt;font-family:
| |
| − | "Courier New"'>o<span style='font:7.0pt "Times New Roman"'> </span></span><span
| |
| − | style='font-size:9.0pt'><img border=0 width=473 height=211 id="Picture 28"
| |
| − | src="ISSS608_VA_Group17_Paper_Wiki_files/image035.jpg"></span></p>
| |
| − |
| |
| − | <p class=MsoListParagraphCxSpMiddle style='text-indent:-18.0pt'><span
| |
| − | style='font-size:9.0pt;font-family:Symbol'>·<span style='font:7.0pt "Times New Roman"'>
| |
| − | </span></span><span style='font-size:9.0pt'>Distribution of Tender Amount by
| |
| − | Ministry</span></p>
| |
| − |
| |
| − | <p class=MsoListParagraphCxSpLast style='margin-left:72.0pt;text-indent:-18.0pt'><span
| |
| − | style='font-size:9.0pt;font-family:"Courier New"'>o<span style='font:7.0pt "Times New Roman"'>
| |
| − | </span></span><span style='font-size:9.0pt'>This is a box plot of the amounts
| |
| − | disbursed in individual tenders.</span></p>
| |
| − |
| |
| − | <p class=MsoNormal align=center style='text-align:center'><img border=0
| |
| − | width=458 height=206 id="Picture 29"
| |
| − | src="ISSS608_VA_Group17_Paper_Wiki_files/image036.jpg"></p>
| |
| − |
| |
| − | <p class=MsoListParagraph style='margin-left:72.0pt;text-indent:-18.0pt'><span
| |
| − | style='font-size:9.0pt;font-family:"Courier New"'>o<span style='font:7.0pt "Times New Roman"'>
| |
| − | </span></span><span style='font-size:9.0pt'>We can zoom in on the values on the
| |
| − | left.</span></p>
| |
| − |
| |
| − | <p class=MsoNormal align=center style='text-align:center'><img border=0
| |
| − | width=416 height=189 id="Picture 30"
| |
| − | src="ISSS608_VA_Group17_Paper_Wiki_files/image037.jpg"></p>
| |
| − |
| |
| − | <p class=MsoListParagraph style='margin-left:39.6pt;text-indent:-21.6pt'><span
| |
| − | style='font-size:9.0pt'>1.2.<span style='font:7.0pt "Times New Roman"'>
| |
| − | </span></span><span style='font-size:9.0pt'>Order Patterns</span></p>
| |
| − |
| |
| − | <p class=MsoNormal>In this screen we explore the variations in procurements
| |
| − | over time. Mainly their counts on a weekly and monthly level.</p>
| |
| − |
| |
| − | <p class=MsoNormal align=center style='text-align:center'><img border=0
| |
| − | width=521 height=262 id="Picture 31"
| |
| − | src="ISSS608_VA_Group17_Paper_Wiki_files/image038.jpg"></p>
| |
| − |
| |
| − | <p class=MsoNormal>There are 2 visualizations.</p>
| |
| − |
| |
| − | <p class=MsoListParagraphCxSpFirst style='text-indent:-18.0pt'><span
| |
| − | style='font-size:9.0pt;font-family:Symbol'>·<span style='font:7.0pt "Times New Roman"'>
| |
| − | </span></span><span style='font-size:9.0pt'>Number of Procurements over the
| |
| − | Years</span></p>
| |
| − |
| |
| − | <p class=MsoListParagraphCxSpMiddle style='margin-left:72.0pt;text-indent:-18.0pt'><span
| |
| − | style='font-size:9.0pt;font-family:"Courier New"'>o<span style='font:7.0pt "Times New Roman"'>
| |
| − | </span></span><span style='font-size:9.0pt'>This one shows the weekly count of
| |
| − | tenders issued.</span></p>
| |
| − |
| |
| − | <p class=MsoListParagraphCxSpMiddle align=center style='margin-left:72.0pt;
| |
| − | text-align:center;text-indent:-18.0pt'><span style='font-size:9.0pt;font-family:
| |
| − | "Courier New"'>o<span style='font:7.0pt "Times New Roman"'> </span></span><span
| |
| − | style='font-size:9.0pt'><img border=0 width=413 height=184 id="Picture 32"
| |
| − | src="ISSS608_VA_Group17_Paper_Wiki_files/image039.jpg"></span></p>
| |
| − |
| |
| − | <p class=MsoListParagraphCxSpLast style='margin-left:72.0pt;text-indent:-18.0pt'><span
| |
| − | style='font-size:9.0pt;font-family:"Courier New"'>o<span style='font:7.0pt "Times New Roman"'>
| |
| − | </span></span><span style='font-size:9.0pt'>This can alo be controlled using
| |
| − | the panel given</span></p>
| |
| − |
| |
| − | <p class=MsoNormal align=center style='text-align:center'><img border=0
| |
| − | width=311 height=174 id="Picture 34"
| |
| − | src="ISSS608_VA_Group17_Paper_Wiki_files/image040.jpg"></p>
| |
| − |
| |
| − | <p class=MsoListParagraphCxSpFirst style='margin-left:72.0pt;text-indent:-18.0pt'><span
| |
| − | style='font-size:9.0pt;font-family:"Courier New"'>o<span style='font:7.0pt "Times New Roman"'>
| |
| − | </span></span><span style='font-size:9.0pt'>Using the above panel, you can
| |
| − | select</span></p>
| |
| − |
| |
| − | <p class=MsoListParagraphCxSpMiddle style='margin-left:108.0pt;text-indent:
| |
| − | -18.0pt'><span style='font-size:9.0pt;font-family:Wingdings'>§<span
| |
| − | style='font:7.0pt "Times New Roman"'> </span></span><span
| |
| − | style='font-size:9.0pt'>Multiple Ministries</span></p>
| |
| − |
| |
| − | <p class=MsoListParagraphCxSpMiddle style='margin-left:108.0pt;text-indent:
| |
| − | -18.0pt'><span style='font-size:9.0pt;font-family:Wingdings'>§<span
| |
| − | style='font:7.0pt "Times New Roman"'> </span></span><span
| |
| − | style='font-size:9.0pt'>Multiple Agencies</span></p>
| |
| − |
| |
| − | <p class=MsoListParagraphCxSpMiddle style='margin-left:108.0pt;text-indent:
| |
| − | -18.0pt'><span style='font-size:9.0pt;font-family:Wingdings'>§<span
| |
| − | style='font:7.0pt "Times New Roman"'> </span></span><span
| |
| − | style='font-size:9.0pt'>Multiple Suppliers</span></p>
| |
| − |
| |
| − | <p class=MsoListParagraphCxSpMiddle style='text-indent:-18.0pt'><span
| |
| − | style='font-size:9.0pt;font-family:Symbol'>·<span style='font:7.0pt "Times New Roman"'>
| |
| − | </span></span><span style='font-size:9.0pt'>Number of Procurements by Type of
| |
| − | Tender</span></p>
| |
| − |
| |
| − | <p class=MsoListParagraphCxSpMiddle style='margin-left:72.0pt;text-indent:-18.0pt'><span
| |
| − | style='font-size:9.0pt;font-family:"Courier New"'>o<span style='font:7.0pt "Times New Roman"'>
| |
| − | </span></span><span style='font-size:9.0pt'>It shows the number of Procurements
| |
| − | split by type on a month level. It is interactive, and you can adjust the
| |
| − | slider below the graph for adjusting the view.</span></p>
| |
| − |
| |
| − | <p class=MsoListParagraphCxSpMiddle align=center style='margin-left:72.0pt;
| |
| − | text-align:center;text-indent:-18.0pt'><span style='font-size:9.0pt;font-family:
| |
| − | "Courier New"'>o<span style='font:7.0pt "Times New Roman"'> </span></span><span
| |
| − | style='font-size:9.0pt'><img border=0 width=400 height=169 id="Picture 33"
| |
| − | src="ISSS608_VA_Group17_Paper_Wiki_files/image041.jpg"></span></p>
| |
| − |
| |
| − | <p class=MsoListParagraphCxSpLast style='margin-left:39.6pt;text-indent:-21.6pt'><span
| |
| − | style='font-size:9.0pt'>1.3.<span style='font:7.0pt "Times New Roman"'>
| |
| − | </span></span><span style='font-size:9.0pt'>Topic Modeling</span></p>
| |
| − |
| |
| − | <p class=MsoNormal>This Screen allows us to build and visualize the LDA based
| |
| − | topic model. As the model building takes more than 6 minutes on average, we
| |
| − | have used a previously saved model to visualize. When you are using the default
| |
| − | data, there is no action required from the user.</p>
| |
| − |
| |
| − | <p class=MsoNormal align=center style='text-align:center'><img border=0
| |
| − | width=421 height=212 id="Picture 35"
| |
| − | src="ISSS608_VA_Group17_Paper_Wiki_files/image042.jpg"></p>
| |
| − |
| |
| − | <p class=MsoNormal>In case we want to build and visualize using the current
| |
| − | data, click on “Current Data”. The system will start generating the model.
| |
| − | There is a possibility that the display will not change until the model is
| |
| − | generated and visualized.</p>
| |
| − |
| |
| − | <p class=MsoNormal align=center style='text-align:center'><img border=0
| |
| − | width=442 height=235 id="Picture 37"
| |
| − | src="ISSS608_VA_Group17_Paper_Wiki_files/image043.jpg"></p>
| |
| − |
| |
| − | <p class=MsoNormal> </p>
| |
| − |
| |
| − | <p class=MsoSubtitle style='margin-left:18.0pt;text-indent:-18.0pt'><span
| |
| − | lang=EN-US style='font-size:9.0pt;line-height:107%;font-family:"Times",serif'>2.<span
| |
| − | style='font:7.0pt "Times New Roman"'> </span></span><span
| |
| − | lang=EN-US style='font-size:9.0pt;line-height:107%;font-family:"Times",serif'>Association
| |
| − | Visualization</span></p>
| |
| − |
| |
| − | <p class=MsoNormal>This section uses network visualizations to visualize the
| |
| − | connections between ministry, agency and supplier.</p>
| |
| − |
| |
| − | <p class=MsoSubtitle style='margin-left:39.6pt;text-indent:-21.6pt'><span
| |
| − | lang=EN-US style='font-size:9.0pt;line-height:107%;font-family:"Times",serif'>2.1.<span
| |
| − | style='font:7.0pt "Times New Roman"'> </span></span><span lang=EN-US
| |
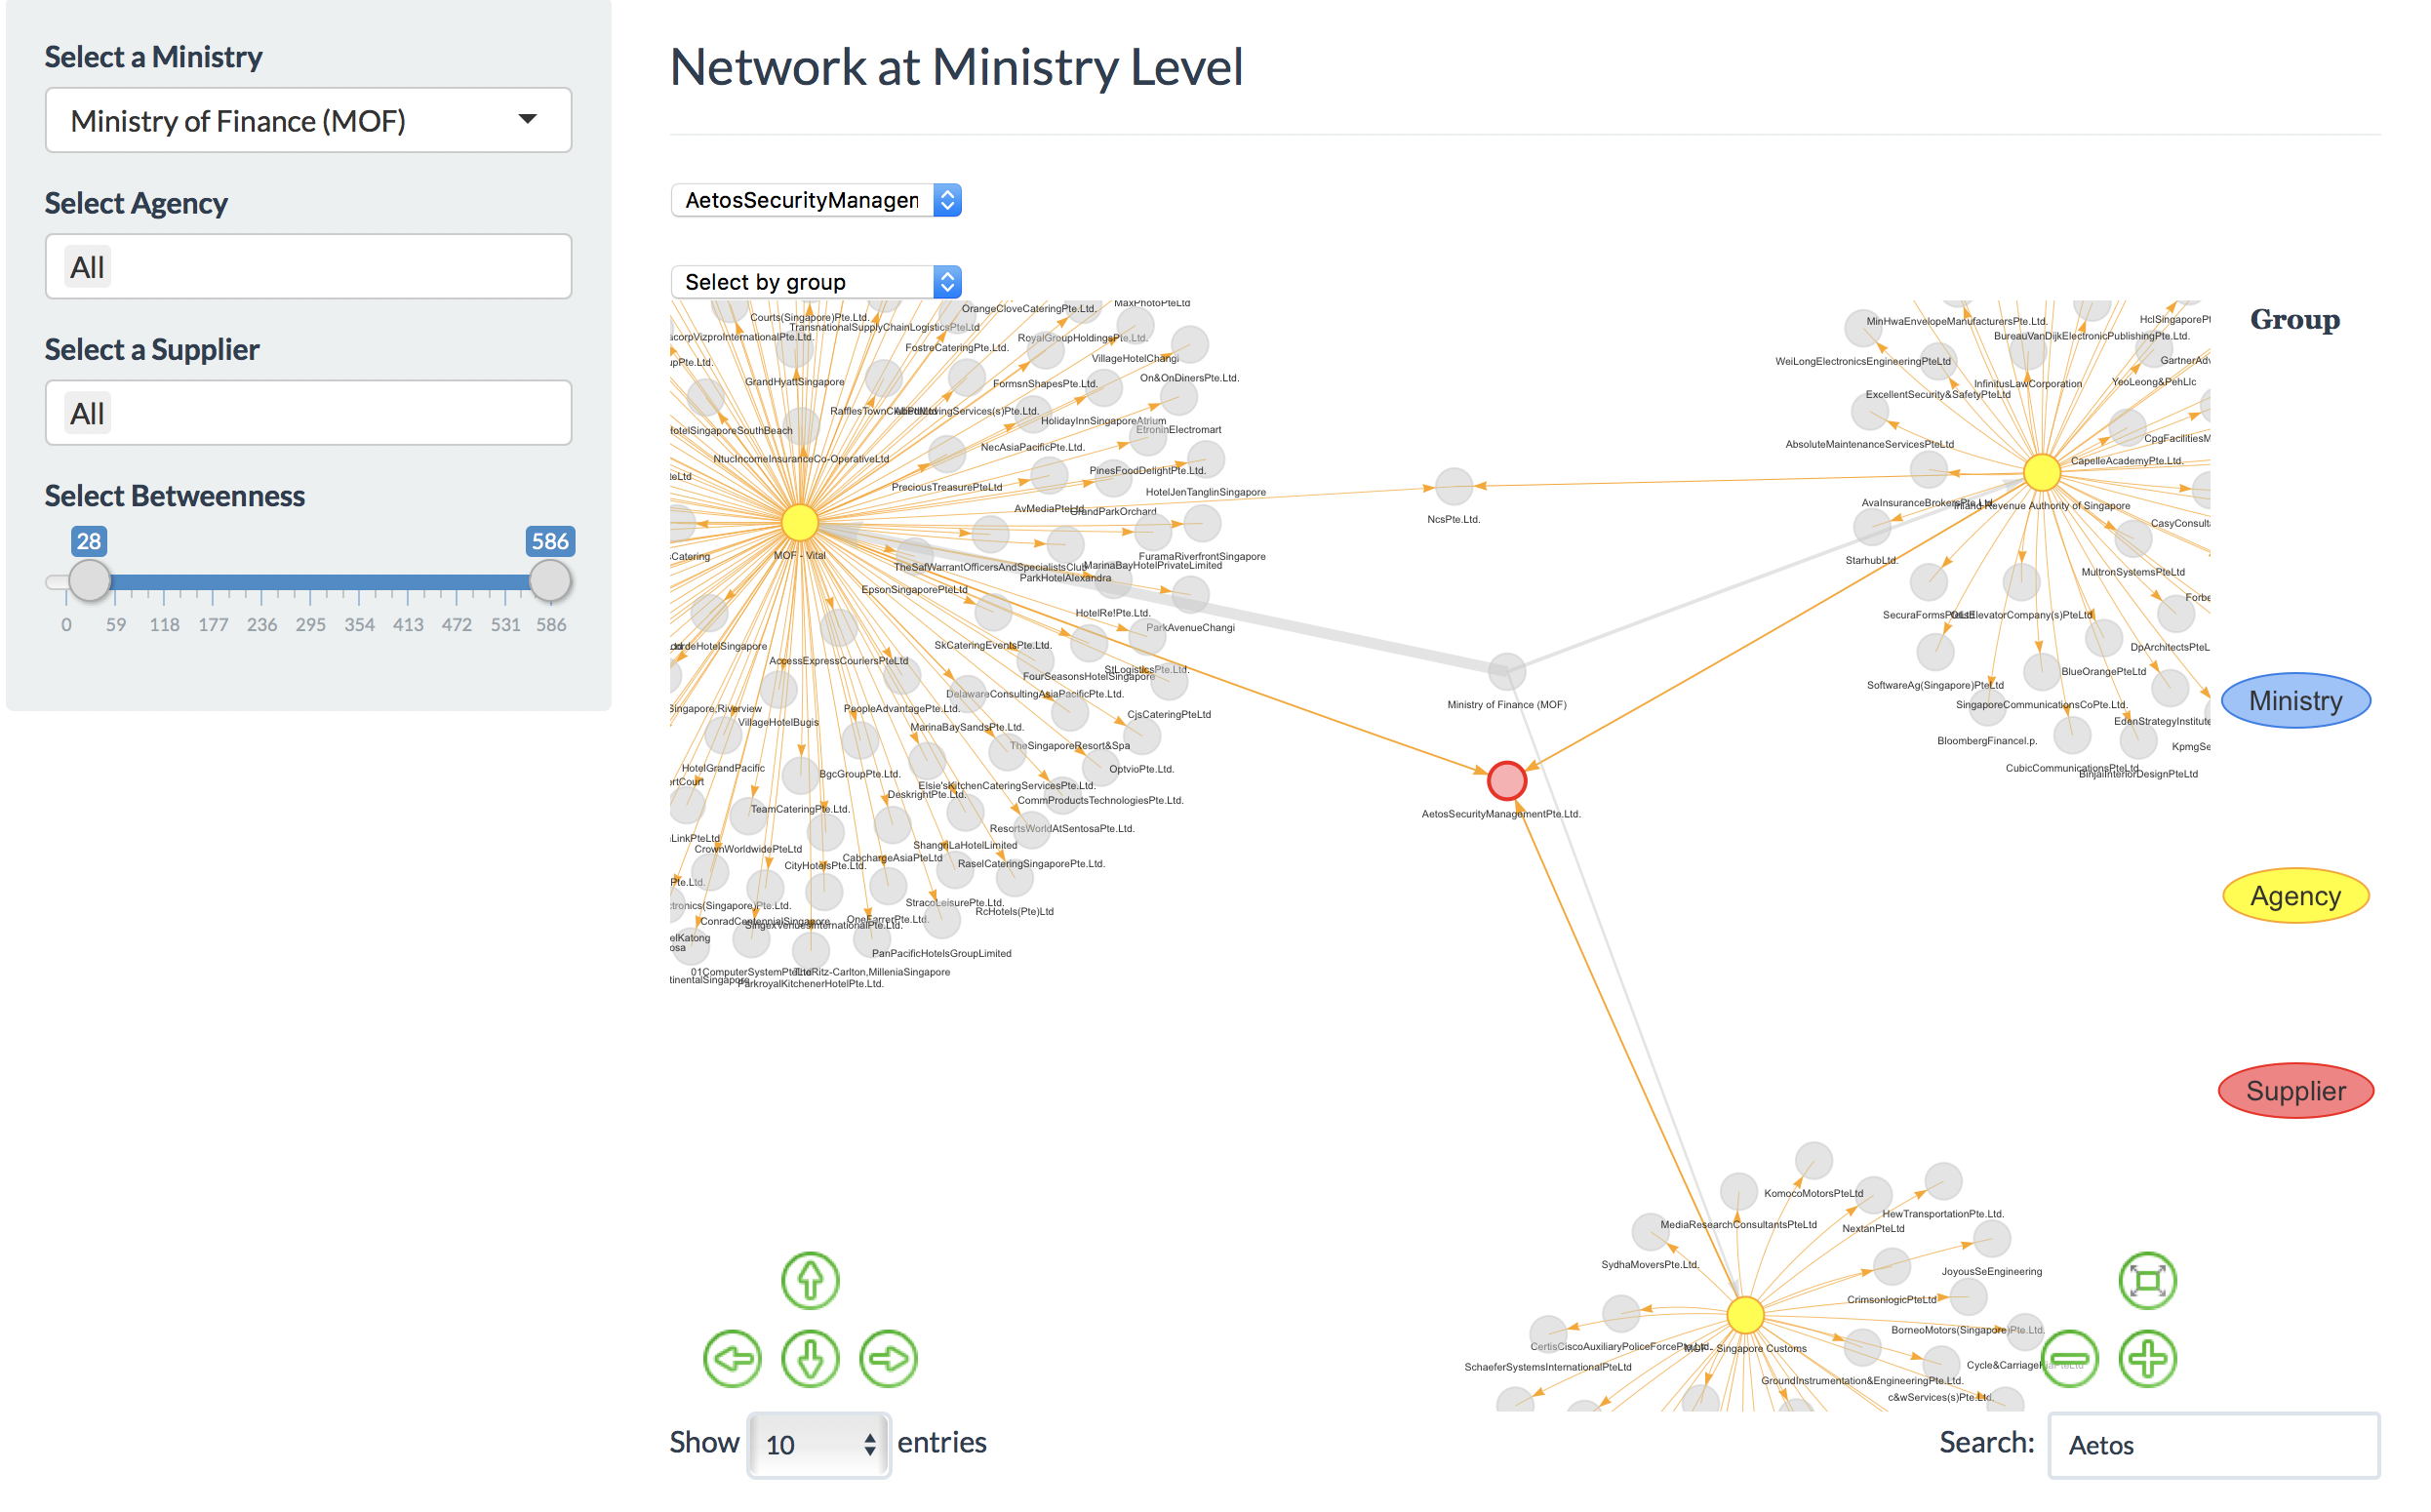
| − | style='font-size:9.0pt;line-height:107%;font-family:"Times",serif'>Overview</span></p>
| |
| − |
| |
| − | <p class=MsoNormal align=center style='text-align:center'><img border=0
| |
| − | width=517 height=258 id="Picture 38"
| |
| − | src="ISSS608_VA_Group17_Paper_Wiki_files/image044.jpg"></p>
| |
| − |
| |
| − | <p class=MsoNormal>Here, the data is visualized at the ministry level. You can
| |
| − | use the controls in the side to</p>
| |
| − |
| |
| − | <p class=MsoListParagraphCxSpFirst style='text-indent:-18.0pt'><span
| |
| − | lang=EN-US style='font-size:9.0pt;font-family:Symbol'>·<span style='font:7.0pt "Times New Roman"'>
| |
| − | </span></span><span lang=EN-US style='font-size:9.0pt'>Select the ministry </span></p>
| |
| − |
| |
| − | <p class=MsoListParagraphCxSpMiddle style='text-indent:-18.0pt'><span
| |
| − | lang=EN-US style='font-size:9.0pt;font-family:Symbol'>·<span style='font:7.0pt "Times New Roman"'>
| |
| − | </span></span><span lang=EN-US style='font-size:9.0pt'>Select Multiple agencies
| |
| − | in that ministry</span></p>
| |
| − |
| |
| − | <p class=MsoListParagraphCxSpMiddle style='text-indent:-18.0pt'><span
| |
| − | lang=EN-US style='font-size:9.0pt;font-family:Symbol'>·<span style='font:7.0pt "Times New Roman"'>
| |
| − | </span></span><span lang=EN-US style='font-size:9.0pt'>Select Suppliers
| |
| − | associated with that ministry.</span></p>
| |
| − |
| |
| − | <p class=MsoListParagraphCxSpMiddle style='text-indent:-18.0pt'><span
| |
| − | lang=EN-US style='font-size:9.0pt;font-family:Symbol'>·<span style='font:7.0pt "Times New Roman"'>
| |
| − | </span></span><span lang=EN-US style='font-size:9.0pt'>To filter based on their
| |
| − | betweenness.</span></p>
| |
| − |
| |
| − | <p class=MsoListParagraphCxSpMiddle><span lang=EN-US style='font-size:9.0pt'> </span></p>
| |
| − |
| |
| − | <p class=MsoListParagraphCxSpMiddle><span lang=EN-US style='font-size:9.0pt'>The
| |
| − | selected data is visible below the graph.</span></p>
| |
| − |
| |
| − | <p class=MsoListParagraphCxSpLast><span lang=EN-US style='font-size:9.0pt'> </span></p>
| |
| − |
| |
| − | <p class=MsoSubtitle style='margin-left:39.6pt;text-indent:-21.6pt'><span
| |
| − | lang=EN-US style='font-size:9.0pt;line-height:107%;font-family:"Times",serif'>2.2.<span
| |
| − | style='font:7.0pt "Times New Roman"'> </span></span><span lang=EN-US
| |
| − | style='font-size:9.0pt;line-height:107%;font-family:"Times",serif'>Supplier
| |
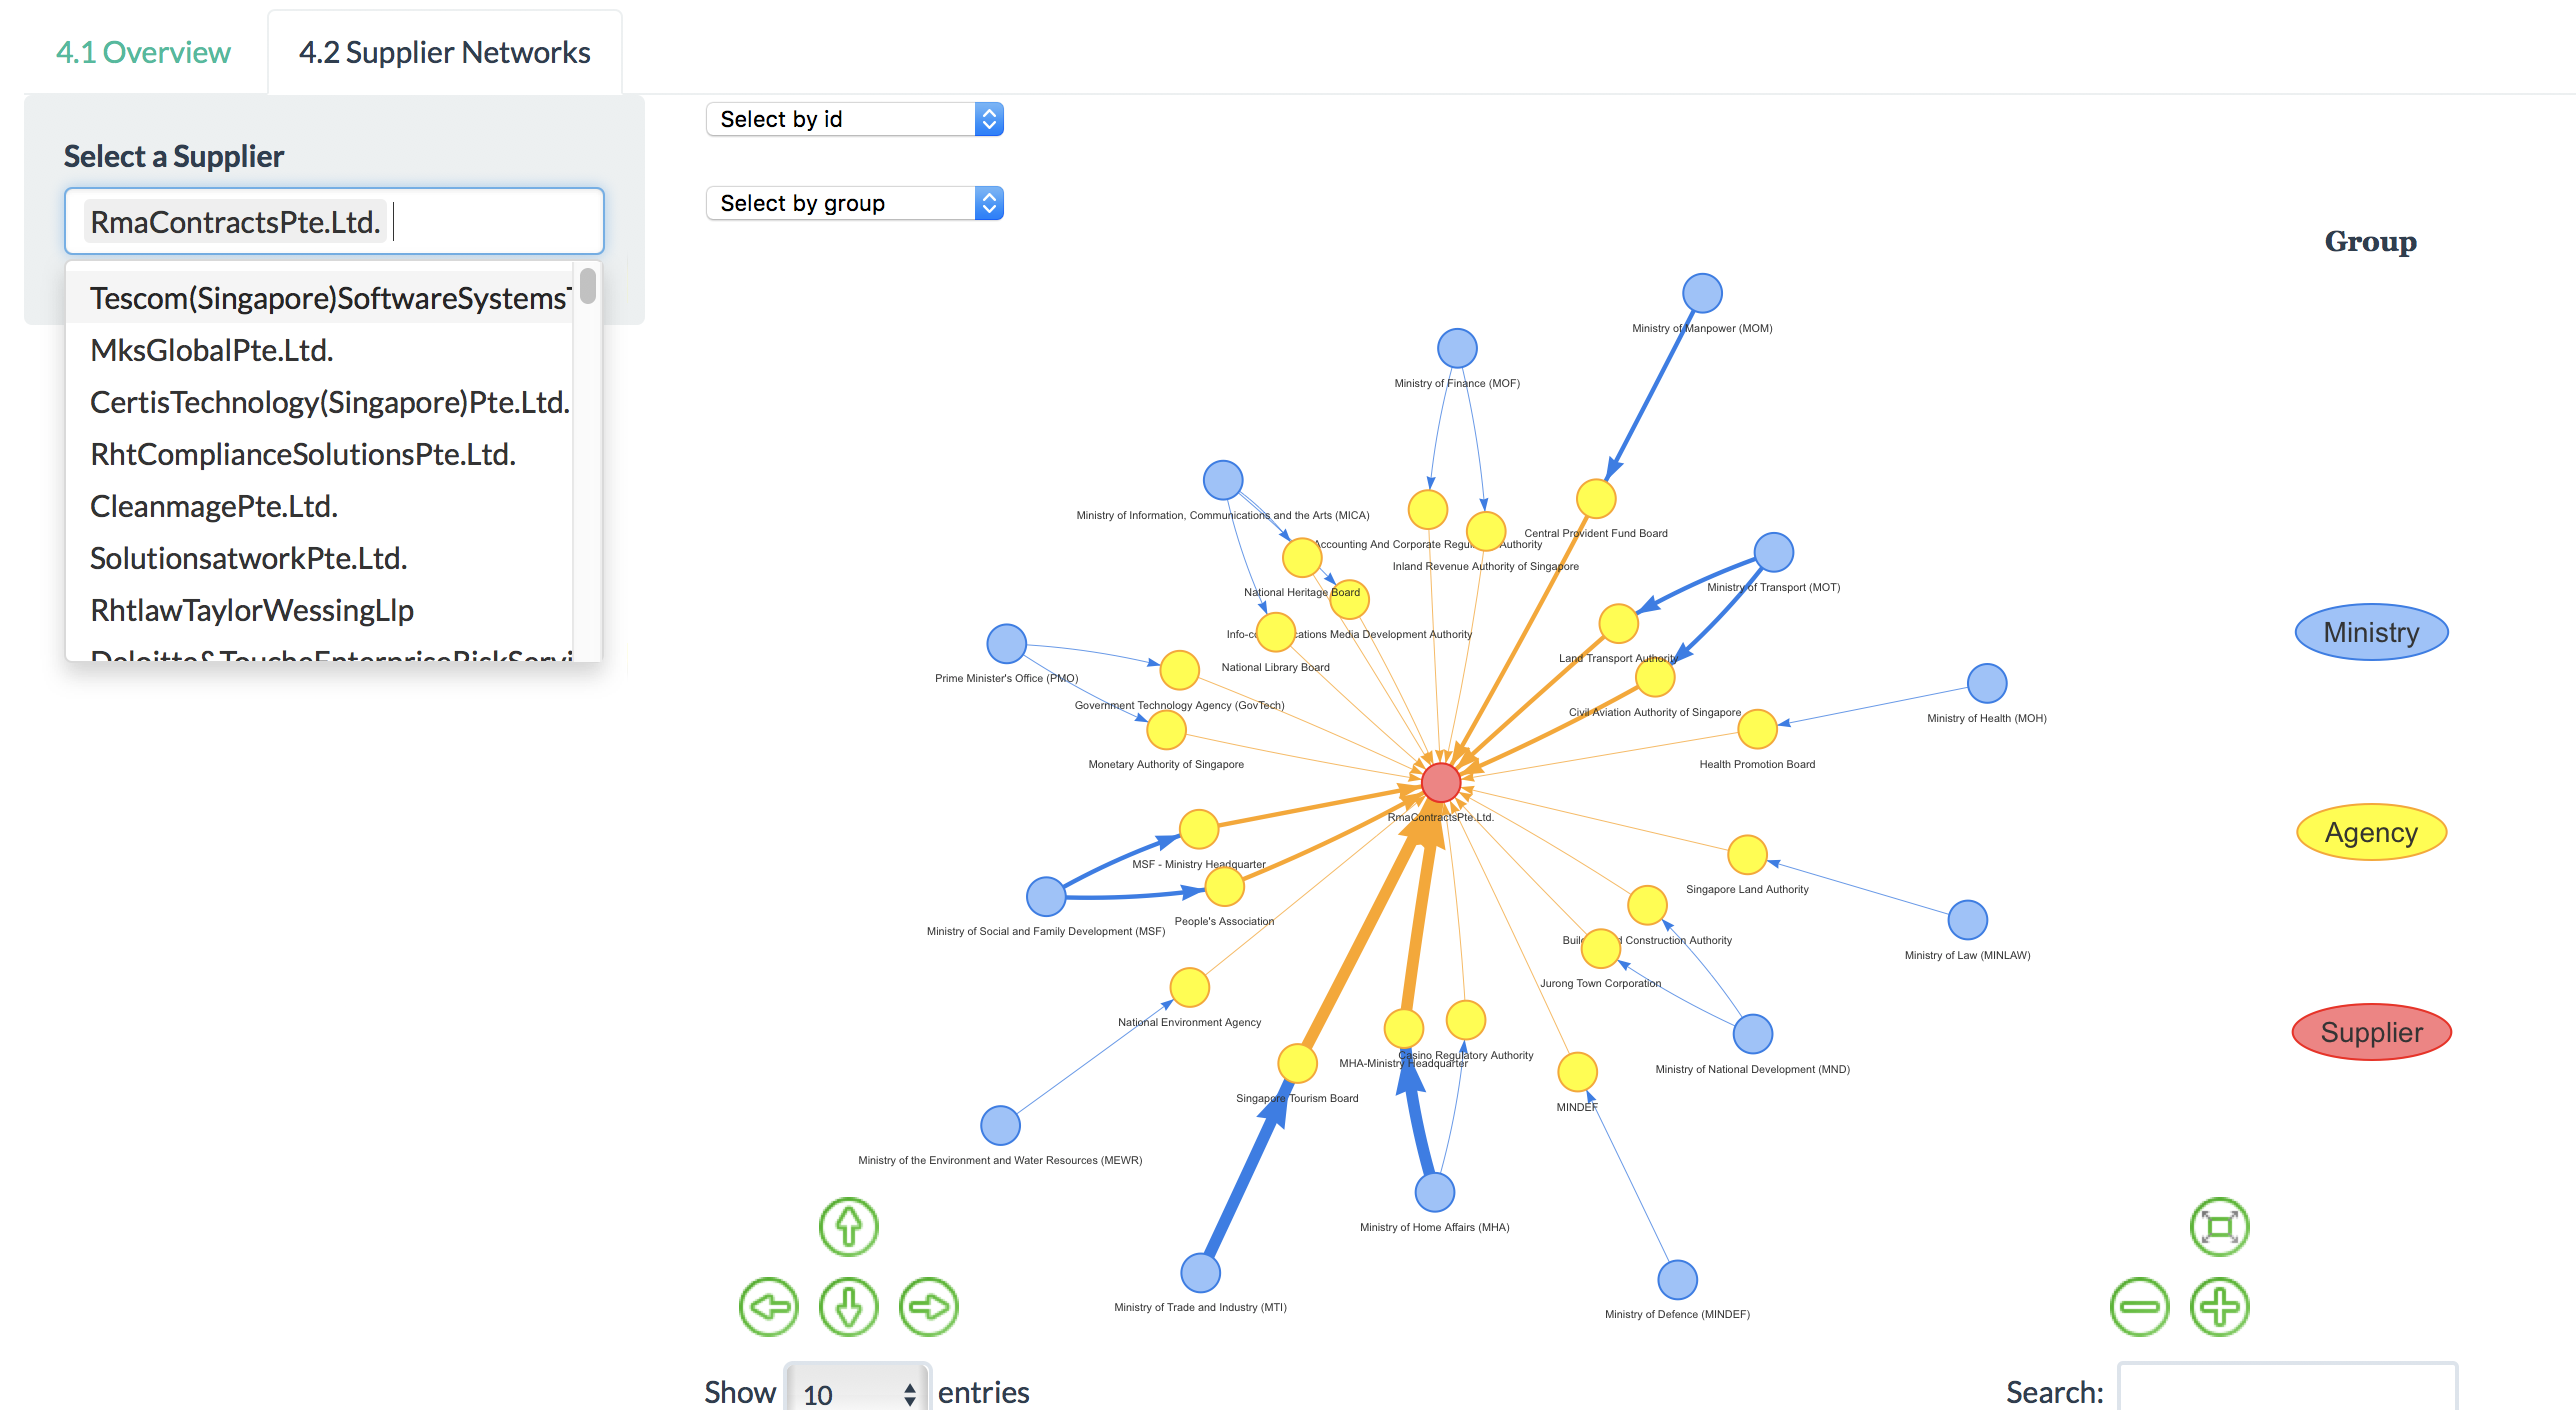
| − | Networks</span></p>
| |
| − |
| |
| − | <p class=MsoListParagraphCxSpFirst><span lang=EN-US style='font-size:9.0pt'>In
| |
| − | this page, we visualize the network based on selected suppliers. By using the
| |
| − | Controls provided you can add more supplier networks into the graph. The
| |
| − | selected data is visible below the graph.</span></p>
| |
| − |
| |
| − | <p class=MsoListParagraphCxSpLast><span lang=EN-US style='font-size:9.0pt'> </span></p>
| |
| − |
| |
| − | <p class=MsoNormal>Sample View for Single Supplier:</p>
| |
| − |
| |
| − | <p class=MsoNormal> </p>
| |
| − |
| |
| − | <p class=MsoNormal align=center style='text-align:center'><img border=0
| |
| − | width=513 height=334 id="Picture 39"
| |
| − | src="ISSS608_VA_Group17_Paper_Wiki_files/image045.jpg"></p>
| |
| − |
| |
| − | <p class=MsoNormal align=center style='text-align:center'> </p>
| |
| − |
| |
| − | <p class=MsoNormal align=center style='text-align:center'> </p>
| |
| − |
| |
| − | <p class=MsoNormal align=center style='text-align:center'> </p>
| |
| − |
| |
| − | <p class=MsoNormal align=center style='text-align:center'> </p>
| |
| − |
| |
| − | <p class=MsoNormal align=center style='text-align:center'> </p>
| |
| − |
| |
| − | <p class=MsoNormal align=center style='text-align:center'> </p>
| |
| − |
| |
| − | <p class=MsoNormal> </p>
| |
| − |
| |
| − | <p class=MsoNormal>Sample View for 2 Suppliers:</p>
| |
| − |
| |
| − | <p class=MsoNormal align=center style='text-align:center'><img border=0
| |
| − | width=542 height=271 id="Picture 40"
| |
| − | src="ISSS608_VA_Group17_Paper_Wiki_files/image046.jpg"></p>
| |
| − |
| |
| − | <p class=MsoNormal> </p>
| |
| − |
| |
| − | <p class=MsoNormal>Sample View of Highlight by Ministry:</p>
| |
| − |
| |
| − | <p class=MsoNormal align=center style='text-align:center'><img border=0
| |
| − | width=531 height=354 id="Picture 41"
| |
| − | src="ISSS608_VA_Group17_Paper_Wiki_files/image047.jpg"></p>
| |
| − |
| |
| − | <p class=MsoNormal> </p>
| |
| − |
| |
| − | <p class=MsoNormal>Sample view of Highlight by ID:</p>
| |
| − |
| |
| − | <p class=MsoNormal align=center style='text-align:center'><img border=0
| |
| − | width=517 height=330 id="Picture 42"
| |
| − | src="ISSS608_VA_Group17_Paper_Wiki_files/image048.jpg"></p>
| |
| − |
| |
| − | <p class=MsoNormal> </p>
| |
| − |
| |
| − | <p class=MsoSubtitle style='margin-left:18.0pt;text-indent:-18.0pt'><span
| |
| − | lang=EN-US style='font-size:9.0pt;line-height:107%;font-family:"Times",serif'>3.<span
| |
| − | style='font:7.0pt "Times New Roman"'> </span></span><span
| |
| − | lang=EN-US style='font-size:9.0pt;line-height:107%;font-family:"Times",serif'>View
| |
| − | and Export Data</span></p>
| |
| − |
| |
| − | <p class=MsoNormal>This section is for viewing the data used for analysis and
| |
| − | saving them to a location in your PC if required. </p>
| |
| − |
| |
| − | <p class=MsoNormal> </p>
| |
| − |
| |
| − | <p class=MsoNormal align=center style='text-align:center'><img border=0
| |
| − | width=482 height=235 id="Picture 43"
| |
| − | src="ISSS608_VA_Group17_Paper_Wiki_files/image049.jpg"></p>
| |
| − |
| |
| − | <p class=MsoNormal>You can:</p>
| |
| − |
| |
| − | <p class=MsoListParagraphCxSpFirst style='text-indent:-18.0pt'><span
| |
| − | lang=EN-US style='font-size:9.0pt;font-family:Symbol'>·<span style='font:7.0pt "Times New Roman"'>
| |
| − | </span></span><span lang=EN-US style='font-size:9.0pt'>Select the number of
| |
| − | rows to display</span></p>
| |
| − |
| |
| − | <p class=MsoListParagraphCxSpMiddle style='text-indent:-18.0pt'><span
| |
| − | lang=EN-US style='font-size:9.0pt;font-family:Symbol'>·<span style='font:7.0pt "Times New Roman"'>
| |
| − | </span></span><span lang=EN-US style='font-size:9.0pt'>Search for records based
| |
| − | on keywords</span></p>
| |
| − |
| |
| − | <p class=MsoListParagraphCxSpLast style='text-indent:-18.0pt'><span lang=EN-US
| |
| − | style='font-size:9.0pt;font-family:Symbol'>·<span style='font:7.0pt "Times New Roman"'>
| |
| − | </span></span><span lang=EN-US style='font-size:9.0pt'>Export Data using the
| |
| − | export button</span></p>
| |
| − |
| |
| − | <p class=MsoNormal align=center style='text-align:center'><img border=0
| |
| − | width=196 height=148 id="Picture 44"
| |
| − | src="ISSS608_VA_Group17_Paper_Wiki_files/image050.jpg"></p>
| |
| − |
| |
| − | <p class=MsoNormal>By pressing the “Export Data” button, the current data will
| |
| − | be saved to </p>
| |
| − |
| |
| − | <p class=MsoNormal>File: [Project Folder
| |
| − | Path]/data/Saved/government-procurement-via-gebiz_export.csv</p>
| |
| − |
| |
| − | <p class=MsoNormal> </p>
| |
| − |
| |
| − | <p class=MsoNormal> </p>
| |
| − |
| |
| − | </div>
| |
GeBiz: Who supplies to the needs of Singapore?
A Visualization-driven mining of hidden associations between government agencies and suppliers.
Click the link below to download the complete report PDF file.
File:ISSS608 VA Group17 Paper.pdf
GeVIZ: Who Supplies the Needs of Singapore?
Introducing A Way to Streamline Operations and Improve Efficiencies
Joel CHOO Peng Yeow, Manu George MATHEW, Yusuke
MINAMI
Abstract— Launched in 2000, the Government Electronic Business (GeBIZ) Portal
is an integrated portal for use by all Singapore government agencies to conduct
business electronically with their suppliers. There are more than S$10 billion
worth of business opportunities published annually to 30,000 suppliers
registered with GeBIZ. Over the years, GeBIZ has accumulated a knowledge base
of procurement data and massive amounts of data is a valuable source of market
knowledge. A Business Intelligence (BI) platform was introduced in 2007 to help
mine this information to help improve the efficiency and effectiveness of
government procurement.
However, like any tool it does have its
advantages and disadvantages. As such, we will be exploring ways to help
improve current tools and increase the ability to garner insights. Predominantly,
we will be exploring network graphs (vizNetwork & tidygraph) using a R
shiny application to help visualise the relationships between the Ministries,
Agencies and Suppliers. This will be an additional feature which many off-the
shelf commercial BI tools are still lacking which could serve beneficial.
Index Terms—GeBIZ, Procurement, Business
Intelligence, Network Graphs, visNetwork, tidygraph, R Shiny.
Motivation of the application
Due to the vast number of quotations
& tenders each year, it becomes extremely challenging to track
transactional patterns and entities who are involved in each of these
contracts. Some of the issues that might have arisen includes:
·
Tedious for potential supplier to research past
tenders, quotations and period contracts of similar purchases across the entire
public sector to determine quotation prices
·
Lack of Ministry oversight on how the budgets
were spent in the individual sectors and service categories
·
Inability to identify reliable suppliers
that many agencies and their respective ministries are purchasing from
·
Recommend appropriate procurement categories and
suggest possible suppliers to invite during the tender notification process
With the provision of GeBIZ procurement data, current analysis is limited to Agencies
and Supplies and we will not be able to view the interactions across
ministries. Furthermore, information on the type of contracts were also embedded
in long text descriptions which makes it difficult to analyse how have budgets
been spent.
In view of current constraints, we are
motivated to create a dynamic and interactive dashboard to help provide
ministries, agencies and suppliers a holistic view on the procurement contracts
made thus far.
Review and critic on past works
The development of Business Intelligence in
GeBIZ started in early 2006. GeBIZ BI initiatives can be broadly divided into
two areas. The first area entails the development of GeBIZ InSIGHT. It
leverages on Machine Learning (ML) techniques to help individual procurement
users research historical buys and gain market insights.
The second area covers the development of
GeBIZ Management Console (GMC). GMC enables macro-level portfolio management
and performance management in the public sector by its features such as
filtering, pivot tables, and charts. As mentioned, the existing tools
could help gain market insights but there are still ways to help improve how we
analyse information with the use of visual analytical techniques. [2]
Design Framework
The overview of our approach can be seen in the following
figure.
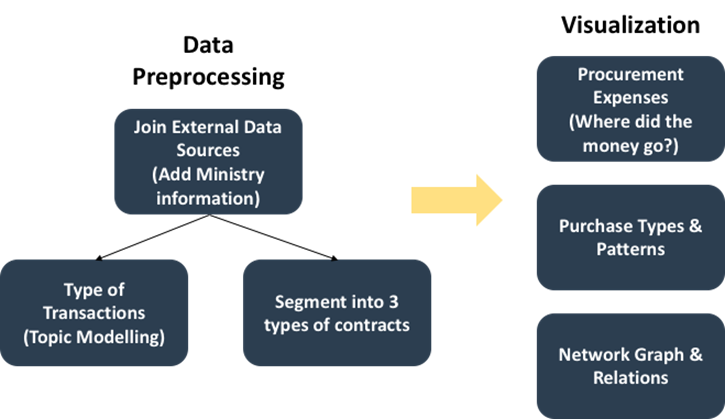
Prior data pre-processing will be
carried out to add in the ministry that these agencies belong to. In addition,
we will segment the contracts based on their dollar value and topic modelling
will also be implemented to determine their respective procurement categories.
With a three–pronged approach, we will help
explore how the procurement expenses look like across ministries, agencies and
suppliers. We will also investigate if there are seasonal patterns and purchase
types specific to an entity. Lastly, we will leverage on the use of network
graphs to help us understand their relationships and extract their procurement
information at ease with an interactive interface.
Network Visualization
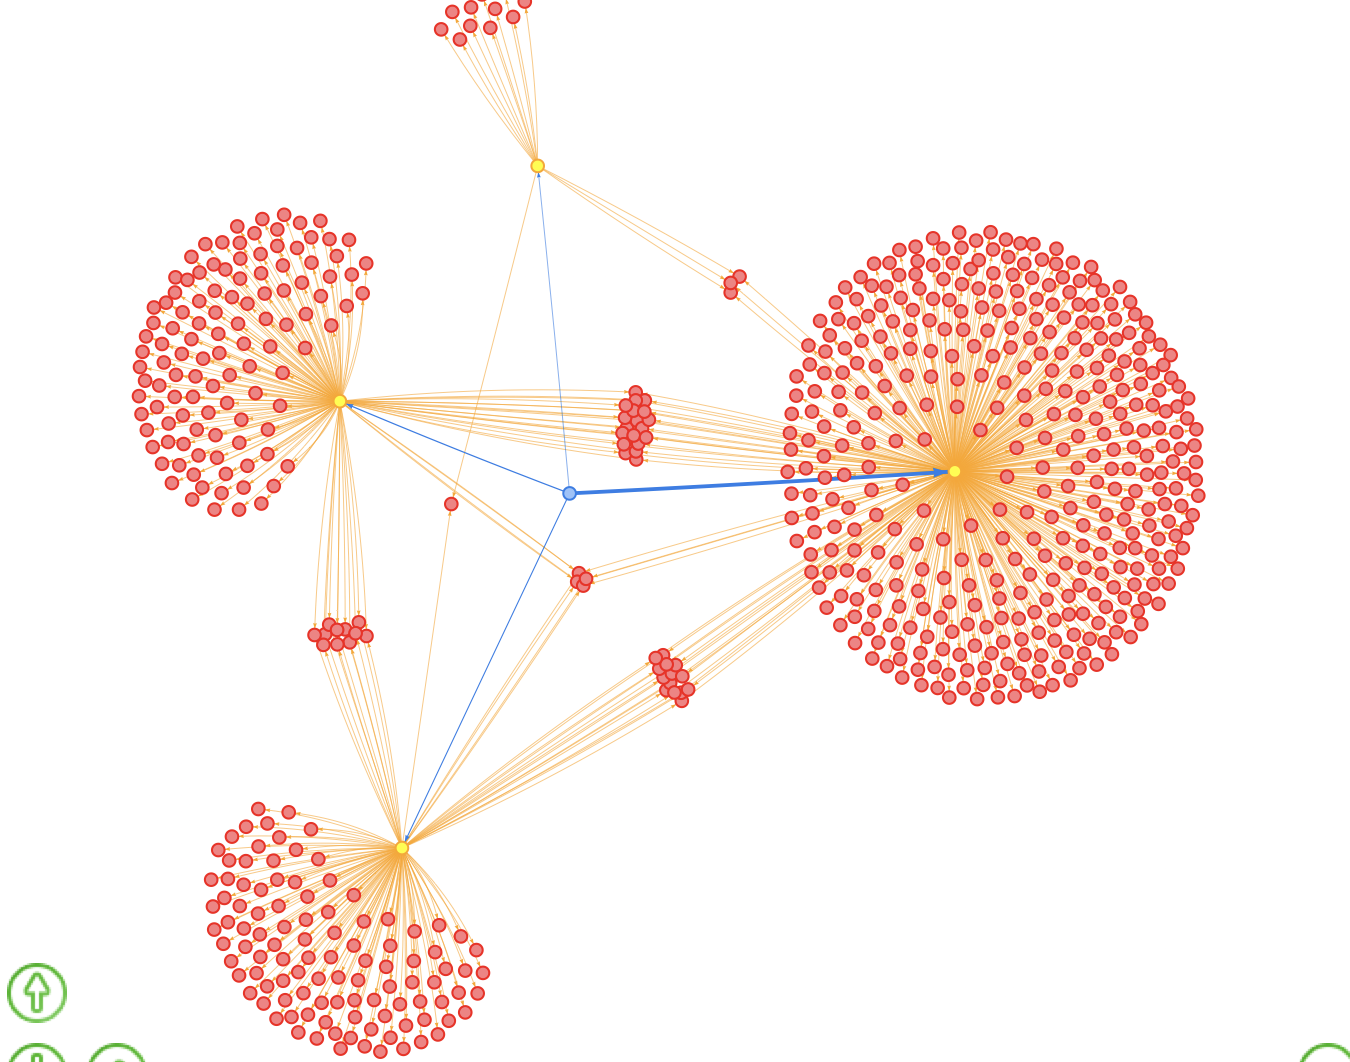
visNetwork was chosen as our preferred library
to visualize network relations as it fosters interactivity which a user will be
able to appreciate when dealing with complex nodes and edges. However, due to
the lack of functions to implement centrality metrices like betweenness, we
have made use of tidygraph to help us with the implementation and
extraction of these additional columns.
In graph
theory, betweenness centrality [9] is a measure of centrality in a
graph based on shortest paths. A node with high betweenness would mean
that it would have more control over the network, because more
information will pass through it. With this
metric in the procurement context, we would like to identify key suppliers
which deals across multiple Agencies.
Definition: Betweenness centrality of a node v is
given by
The transition from tidygraph to visNetwork,
however requires us to manipulate our data before it will be compatible for the
individual libraries. In tidygraph, we need to ensure that the columns are
renamed to “source” and “target” while visNetwork uses “from” and “to”. Using dplyr,
we can easily perform dataframe manipulation.
As tidygraph also creates a tbl_graph which contains
two tibble object where we can use a combination of activate and as_tibble
functions to help extract the node and edge table.
Fig. 3: tbl_graph
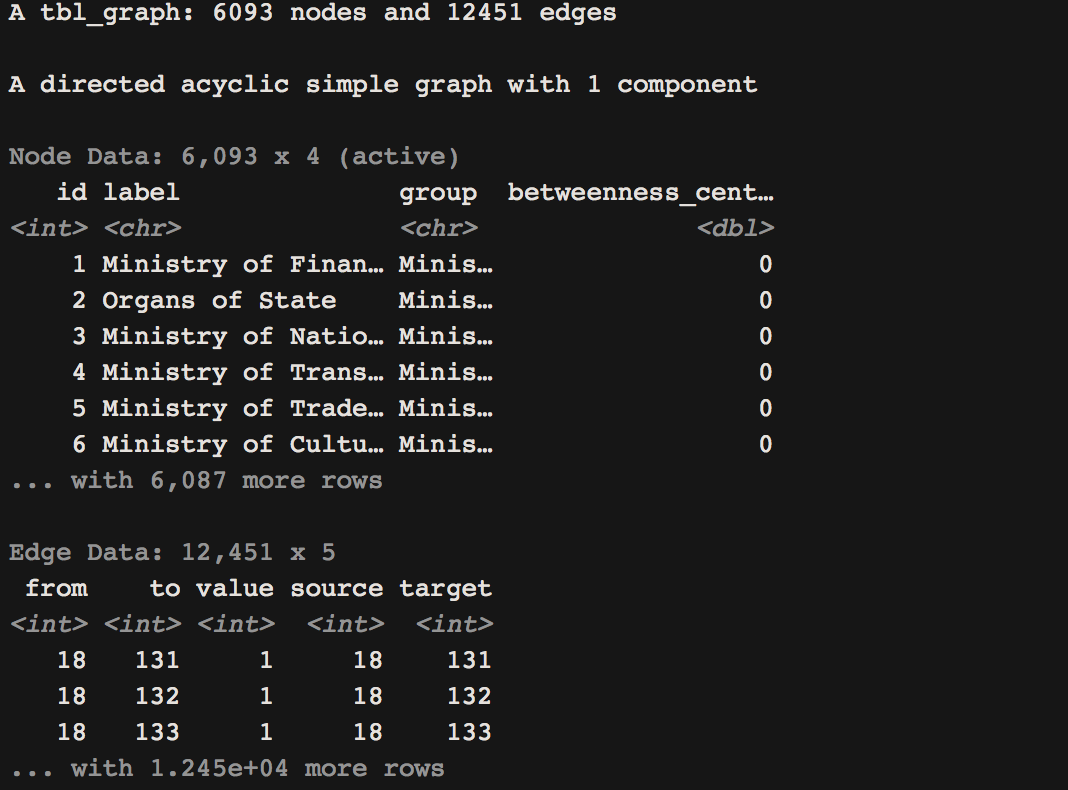
Once we have the relevant information, we can create a
“Group” column and visNetwork will be able to display these groups as distinct
colours. Setting the number of contracts as “value” also help visNetwork plot
edges with difference thickness. The thicker the edge, the more contracts that
are involved between 2 nodes.
Treemap
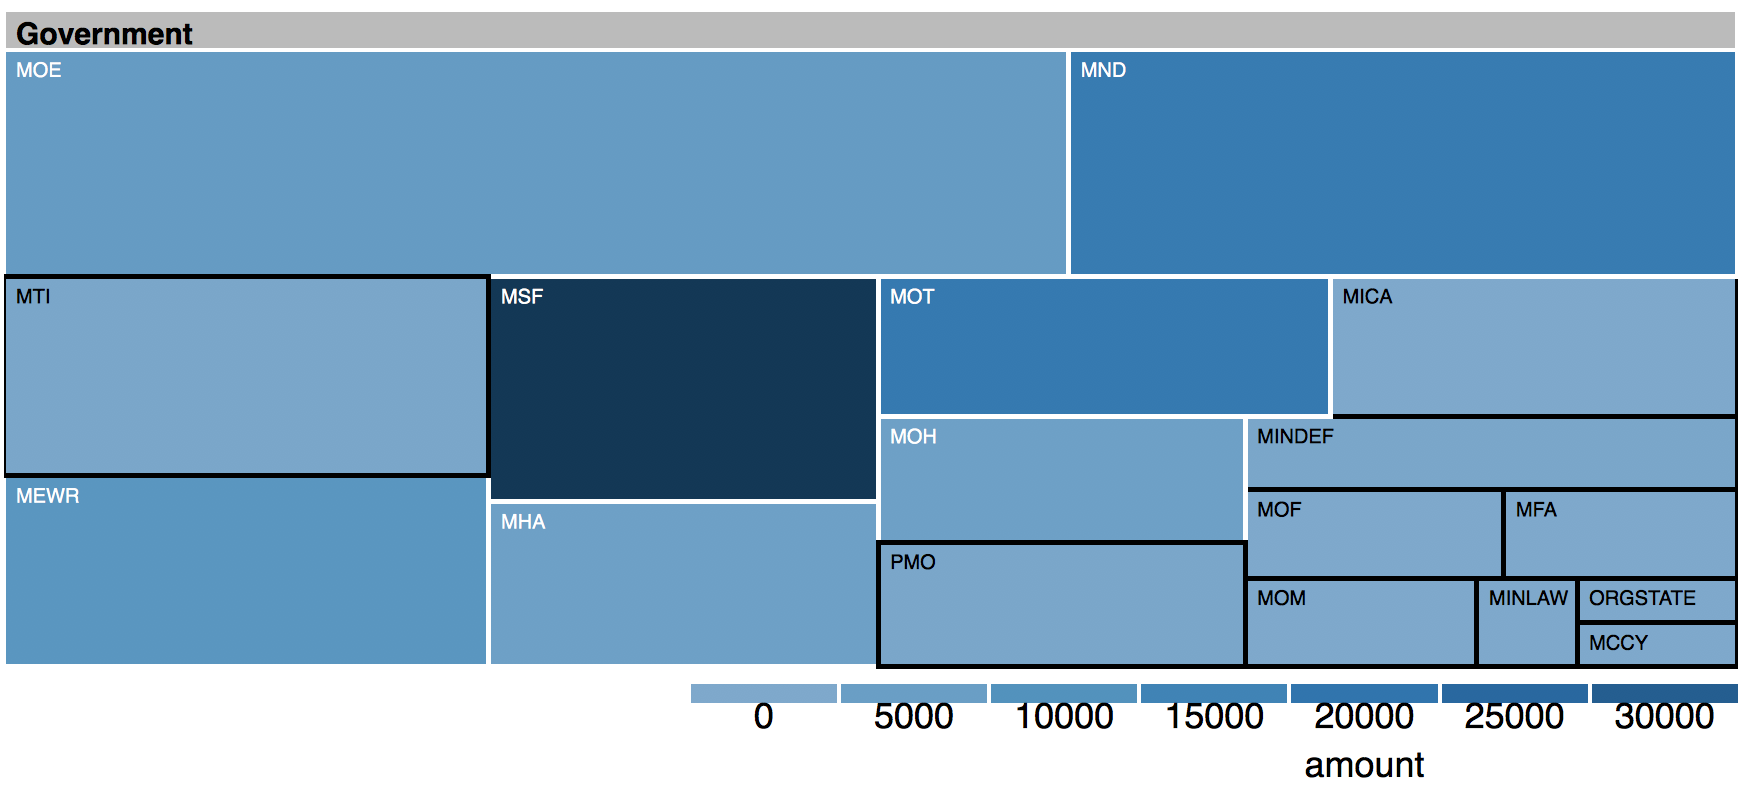
Treemap is a powerful way to visualize
hierarchical data using nested rectangles. The advantage is that all data can
be visualized in a single page utilizing rectangle area for the primary
measure, and color for the second measure. Treemaps can be generated by a d3treeR
library (https://github.com/d3treeR/d3treeR) in R.
While looking at Procurements,
visualizing expenses at the Ministry and Agency level help us identify key
spenders. This is useful when we want to know which ministry and which agency
in that ministry tend to spend more. We use a Treemap Diagram to visualize the
expenses at the ministry Level. The size of the tiles in the Treemap represent
the number of orders placed by the ministry and the color indicates the amount
spent. In the Sankey, we show the spending at ministry level for its top N
agencies and the top N suppliers within each individual agency.
Sankey Diagram
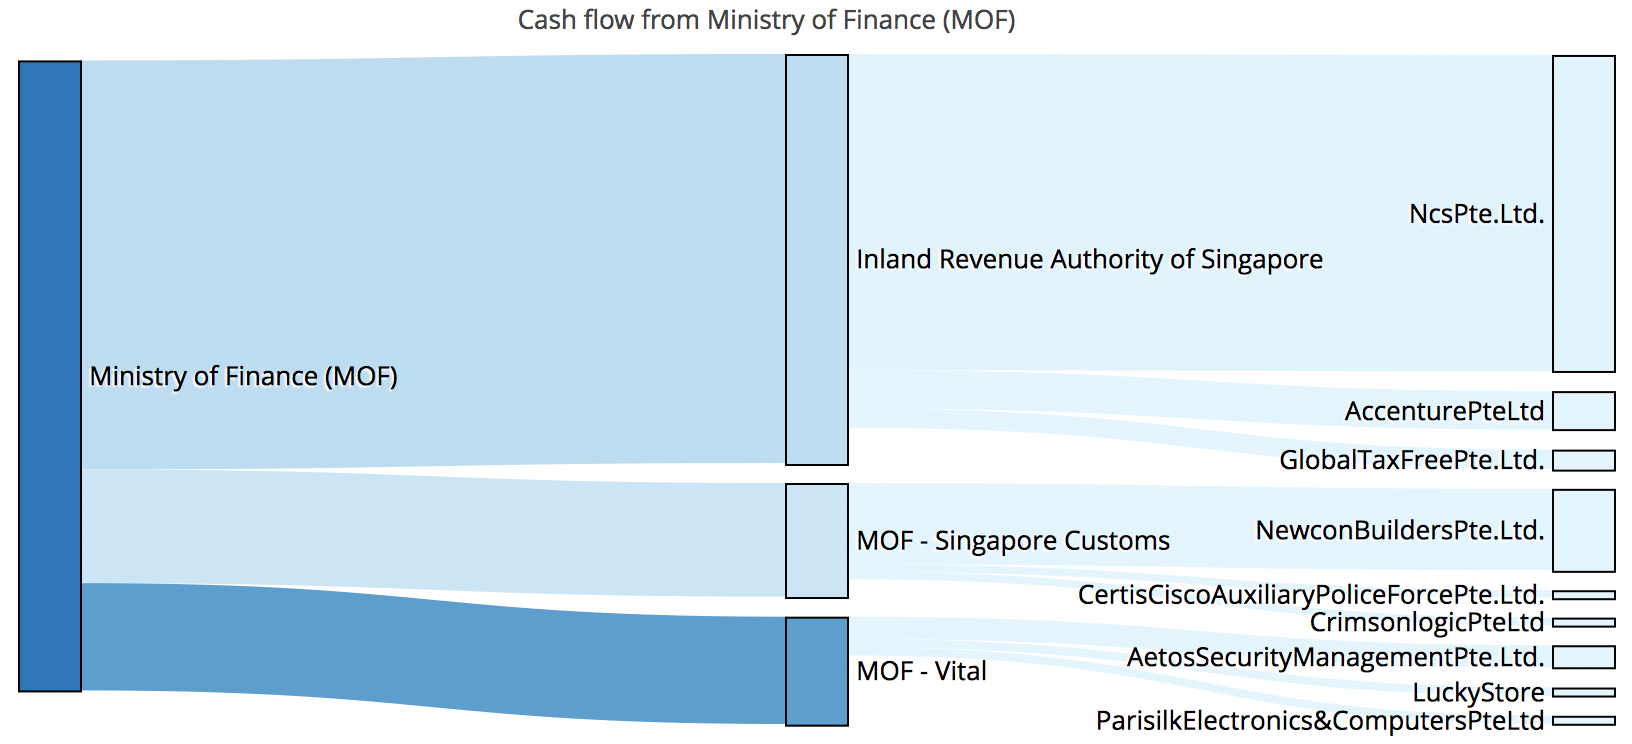
Sankey Diagram is another effective way
to visualize a network graph as flow. The advantage of Sankey Diagram over Sunburst
Diagram and regular network visualization is that nodes (and thus node labels)
and edges are aligned in line, and the primary measure (count of procurement or
monetary value SG$ in our dataset) represented by edge width can be compared
with each other easily. In addition, the second measure can be represented by
the color. Sankey Diagram can be generated by Plotly library
(https://plot.ly/r/sankey-diagram/) in R.
Latent Dirichlet Allocation
Latent Dirichlet Allocation (LDA) is an example of Topic
Modeling technique that enabled us to extract procurements type information
from text descriptions. LDA assumes each word in each text sample was chosen
from topics which consist of words which have different probabilities to be
chosen. Given the number of topics, LDA determines 2 distributions; distribution
of words for each topic, and distribution of topics for each text sample. LDA
can be run by lda library (https://cran.r-project.org/web/packages/lda/lda.pdf)
in R. LDA was used to extract information from the text description column in
our dataset. The output of LDA can be visualized on the plane of principal
component axes by LDAvis library in R. (https://nlp.stanford.edu/events/illvi2014/papers/sievert-illvi2014.pdf)
Fig. 6: Visualized result of LDA
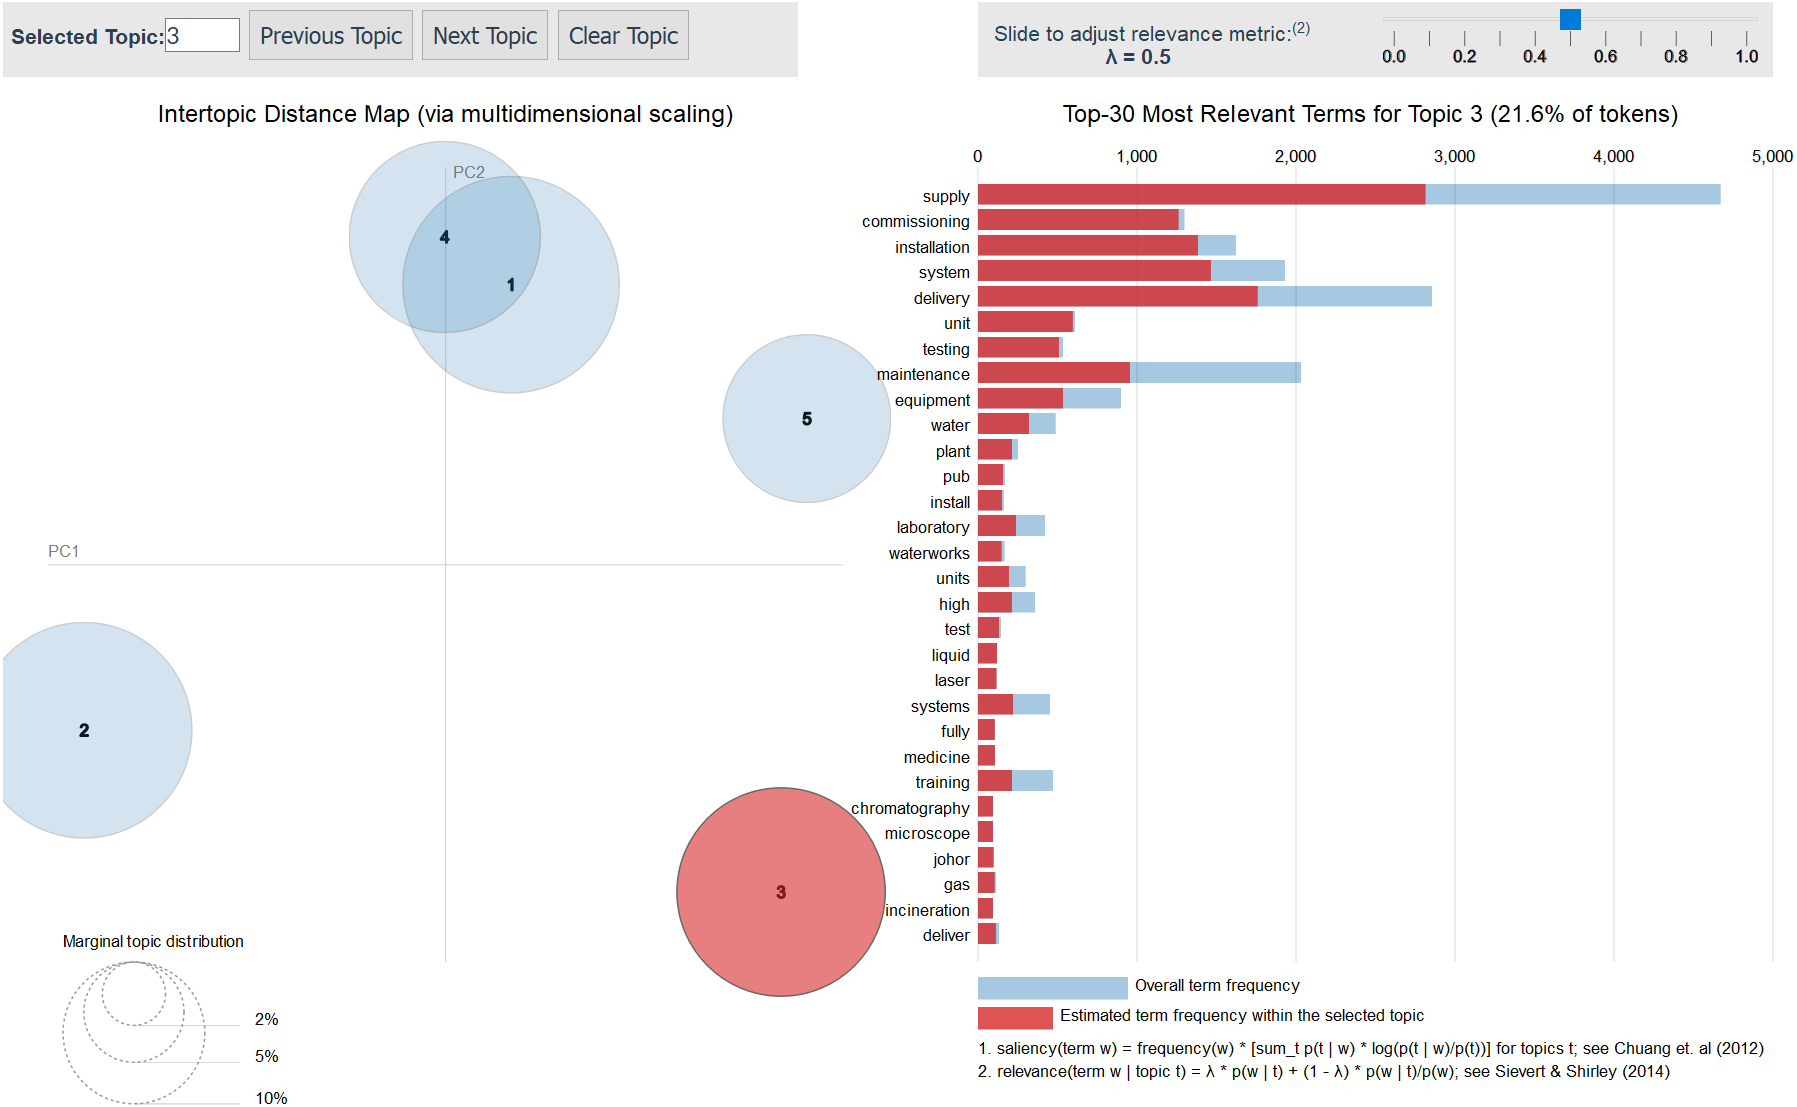
LDA by setting the number of topics to 5 extracted 3 distinct
topics (Topic 2, 3, and 5) on the plane of principal components as shown in the
above screenshots. Based on the interactive visualized results, the 5 topics
were labeled as follows.
Topic 1: Communication (relevant words: invitation,
appointment, proposal, request])
Topic 2: Task (relevant words: works, engineering,
consultancy, upgrading, building, road])
Topic 3: Product support (relevant words: system,
installation, maintenance, testing)
Topic 4: General (relevant words: period, term, month,
option)
Topic 5: Public/Organization (relevant words: school,
boards, state, departments, organs)
Time Series
1.
Calendar Plot
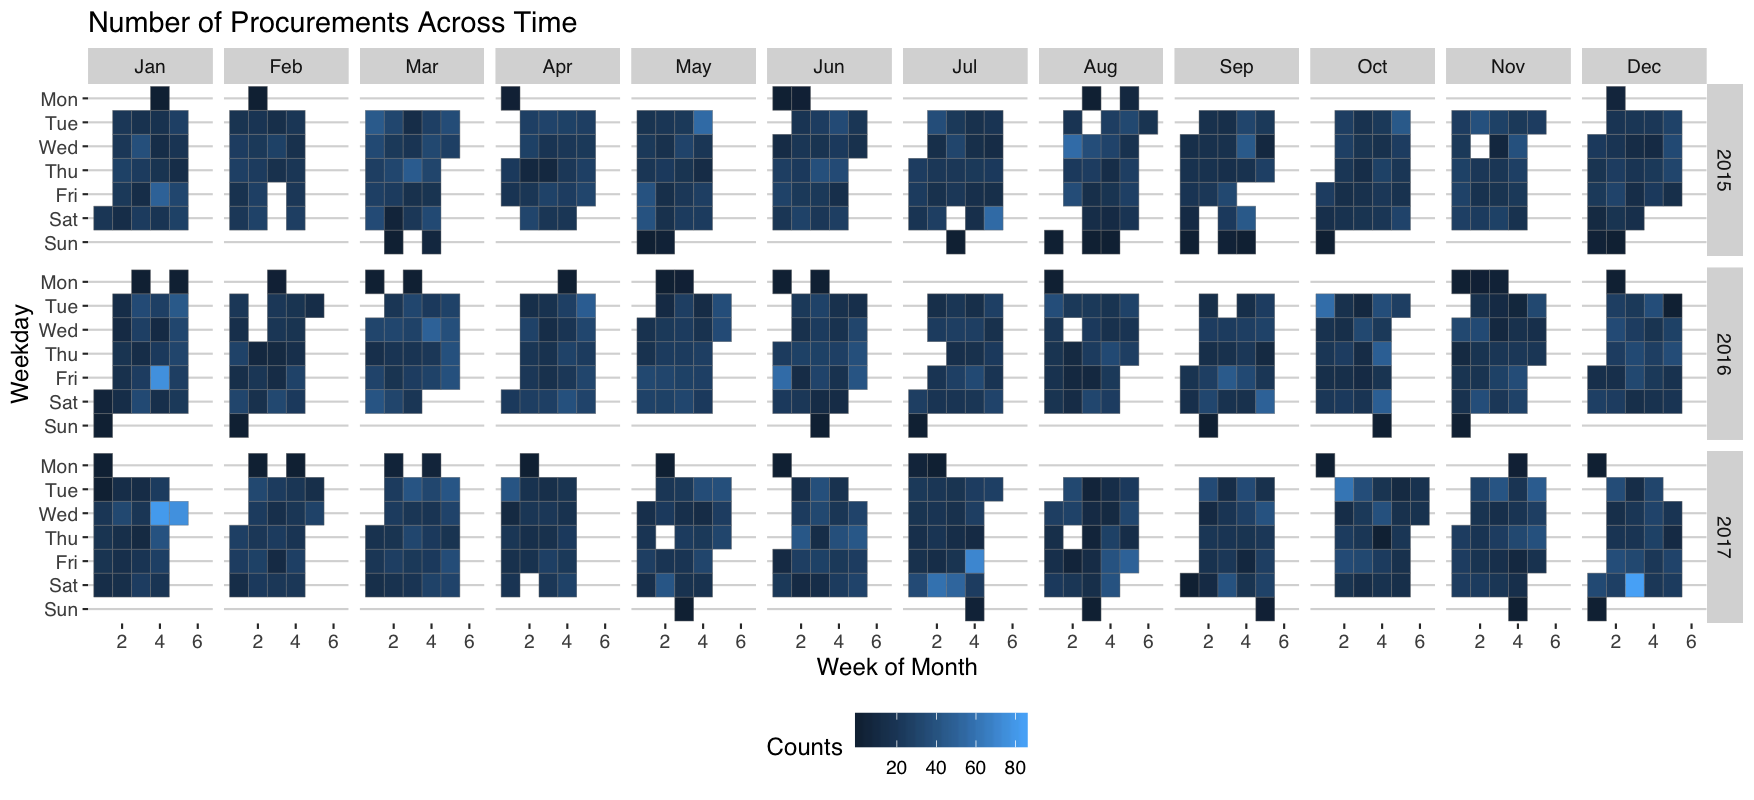
The essence to plot a calendar chart
requires us to be able to manipulate data time to the necessary formats before
we can obtain our desired graph. More importantly, string variables needs to be
converted as factors so that weekdays and months could be interpreted as ordinal
variables.
Using ggplot2 with its geom_tile
function, we can visualise the number of procurements across time in a calendar
chart. This will help us identify if there are seasonality or cyclical patterns
within an agency or supplier. For this example, one of the ministries tend to
procure more during the end of the month. This will be useful for suppliers to
help prepare for these peak bidding cycles.
2.
Stacked Line Chart
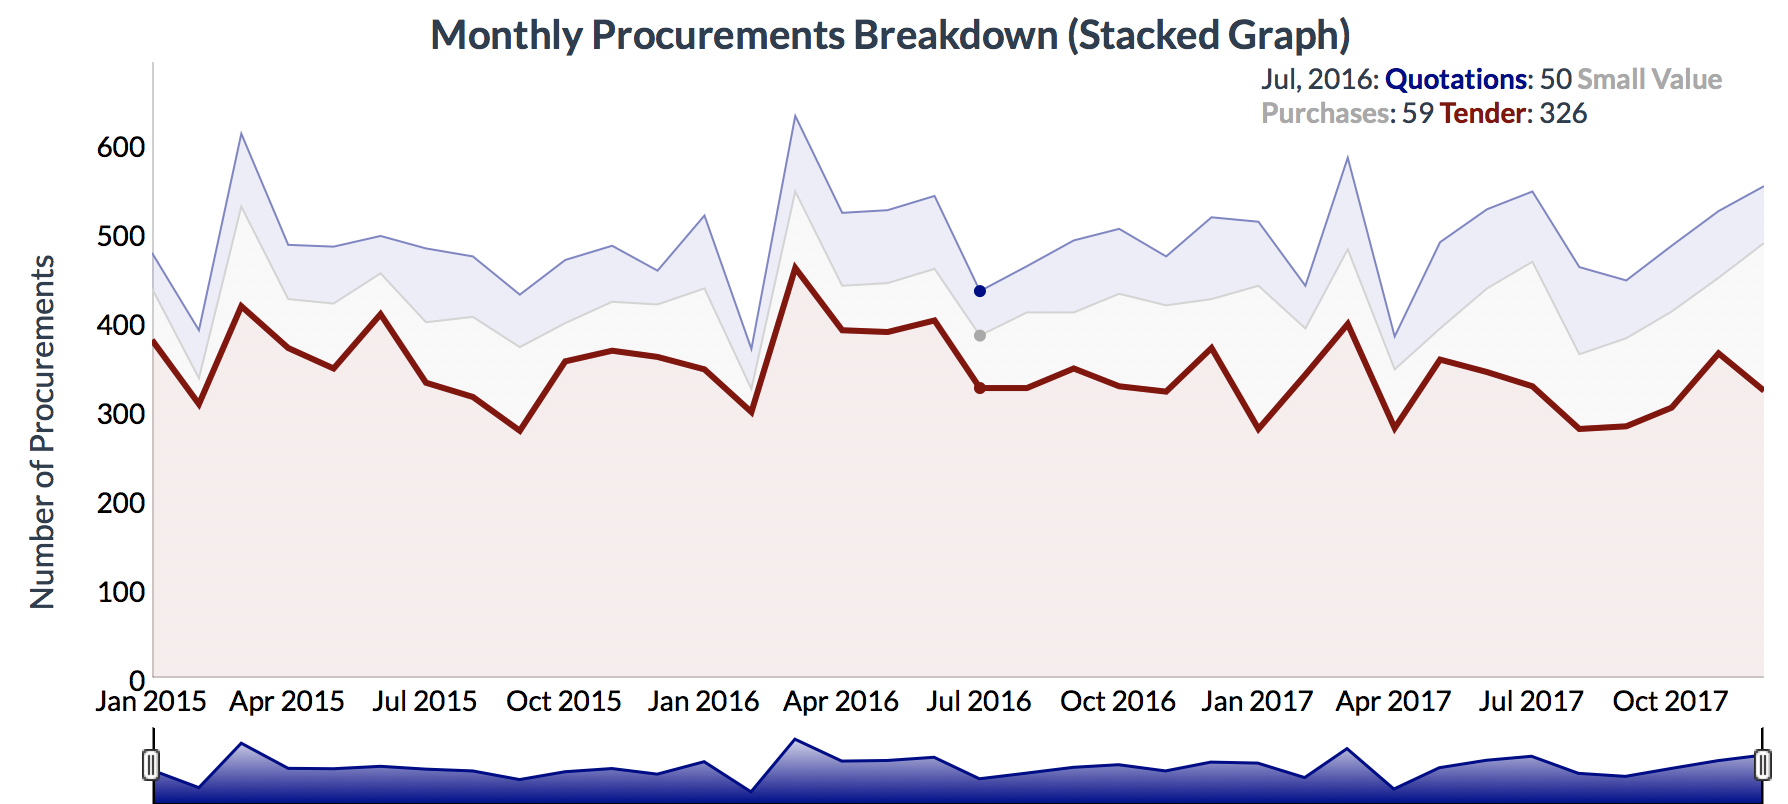
The stacked plot was created using the dygraph library which is a
fast, reliable open source JavaScript charting library. Aggregating the number
of contracts by month using dplyr, we are able to identify trends
& proportion of contracts contributed by the individual tenders segments. Upon
inspection, a cyclical pattern becomes obvious with a spike in the number of
contracts before April, which coincides with the end of the financial year.
Demonstration – A MOF CASE STUDY
Considering the limitations of current Business
Intelligence (BI) tools for GeBiz in place [2], we will place more emphasis on the
use of network graph to help identify the hierarchical relationships amongst
entitles in this section.
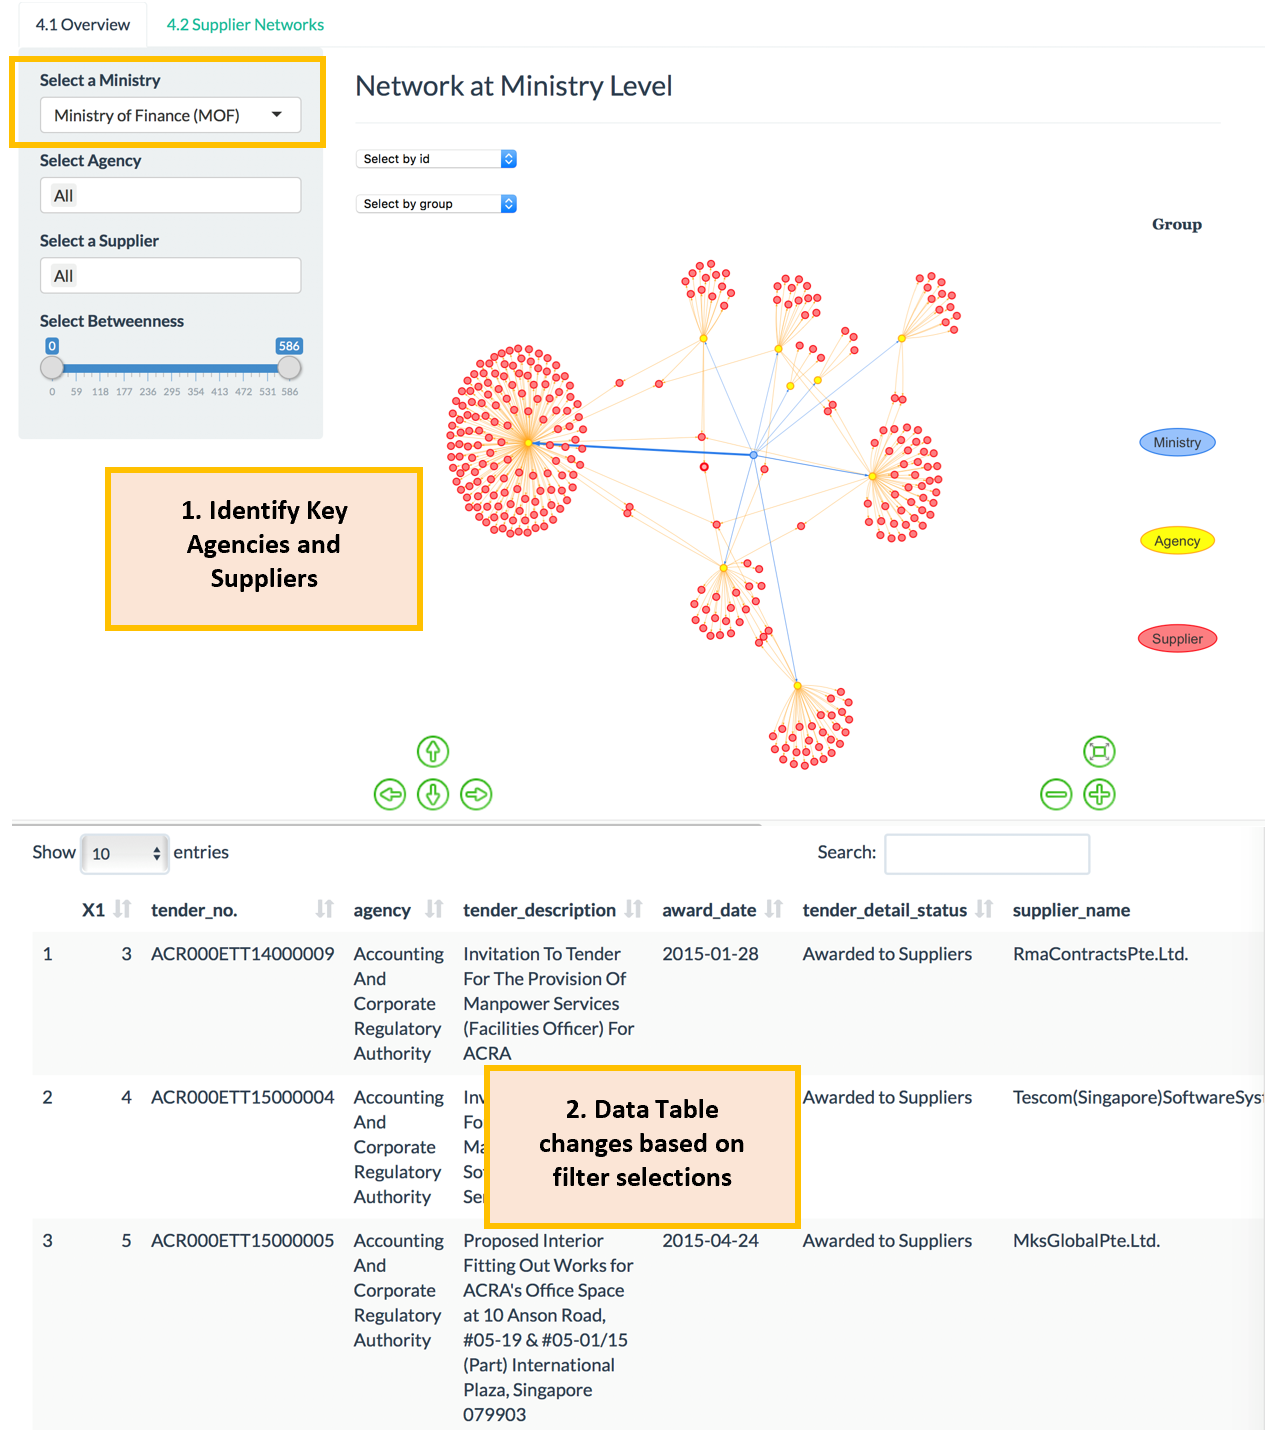
Using Ministry of Finance (MOF) as an example,
we will be able to identify its respective Agencies and also their suppliers where
they have individually engaged with thus far. This provides an oversight on who
the budgets were spent on in the individual sectors.
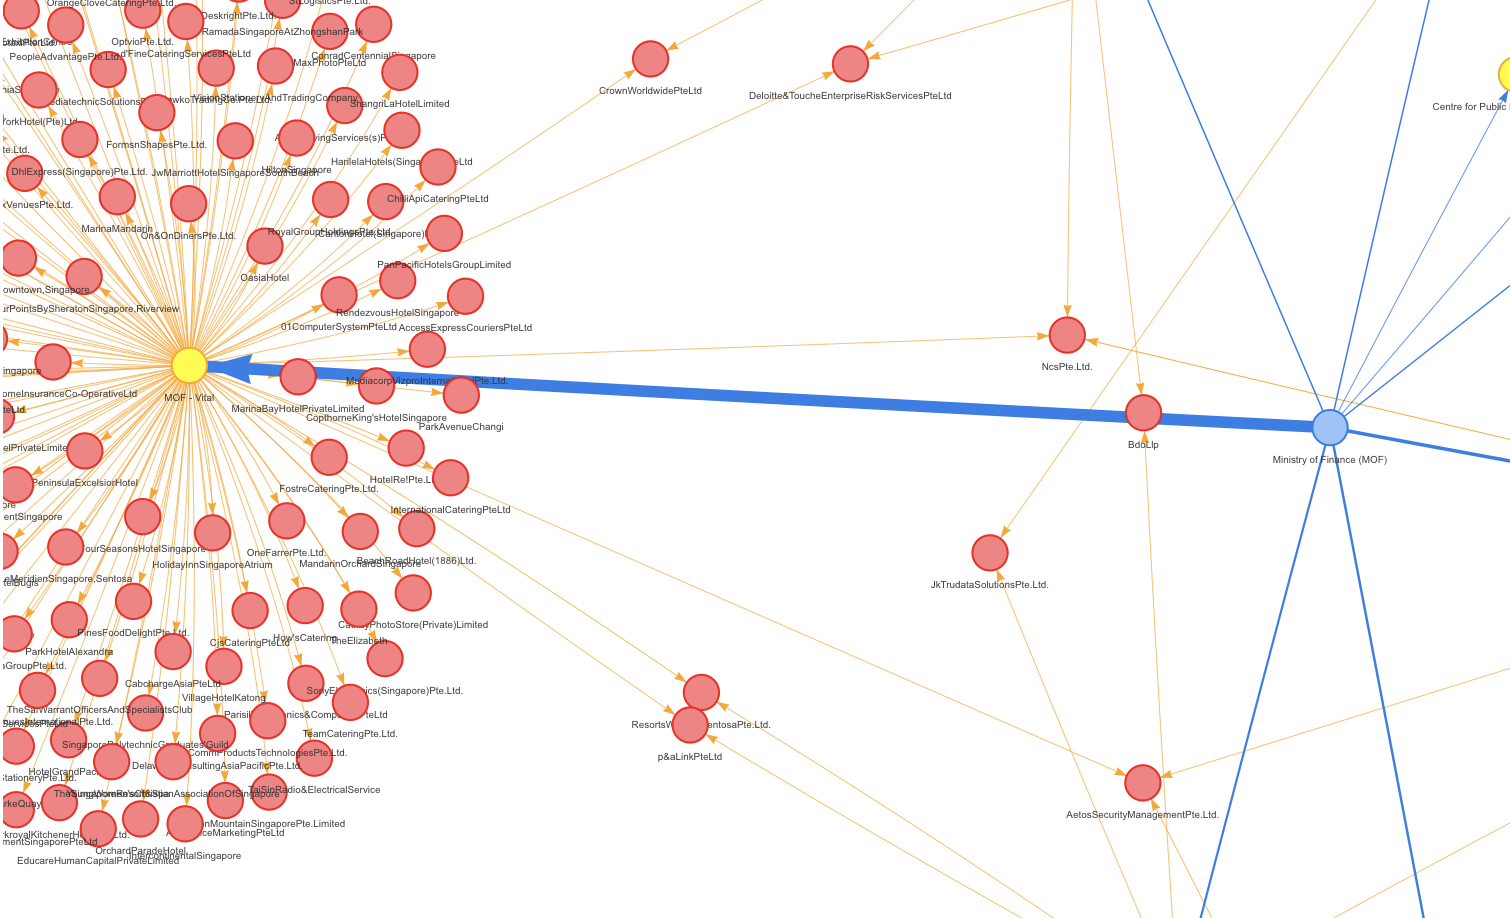
As the chart is interactive, we will be able to
drag around the nodes and zoom in to uncover who have made the most number of
contracts.
Here, MOF – Vital have sent out the
greatest number of tenders amongst other agencies from MOF.
If we are interested to know the details of the
tenders MOF – Vital have made, we can filter based on Agency and view the
details in an interactive data table below. Sorting by awarded date, we will be
able to find out the most recent contracts.
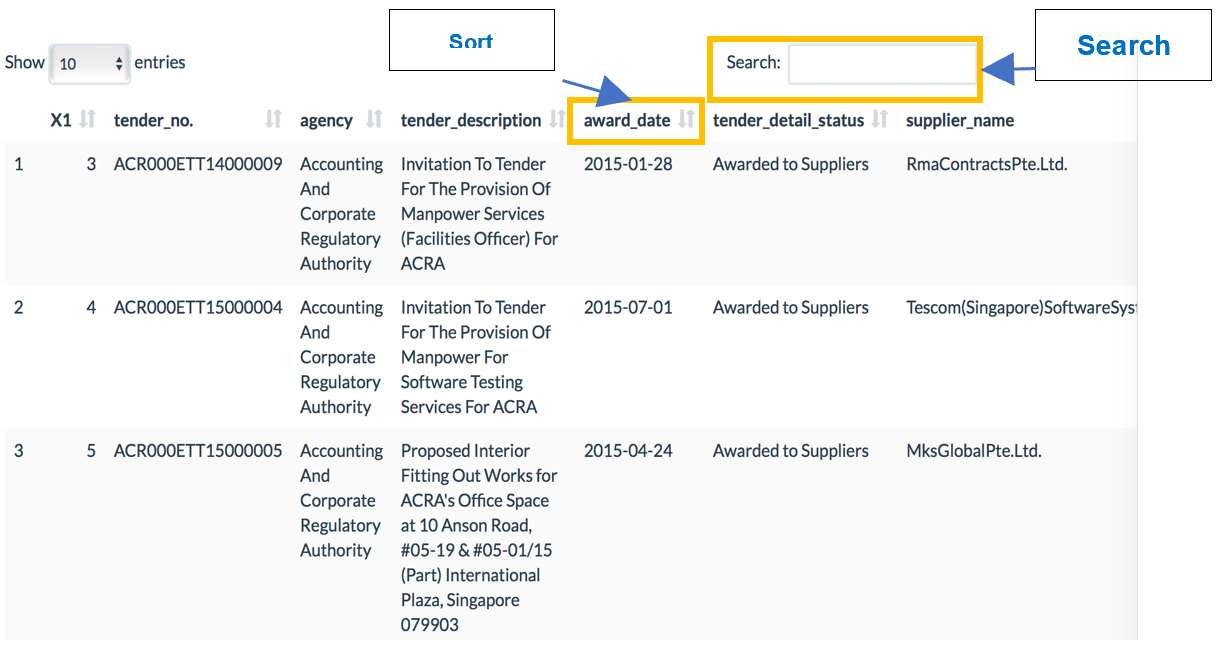
The inclusion of the search function also allows
us to find out past quotations of similar procurement types. This will help
suppliers research past tenders, quotations and period contracts of similar
purchases across the entire public sector to determine quotation prices. This
will not be made possible without the use of LDA where it has helped us
generate a series of procurement types which a tender could belong to.
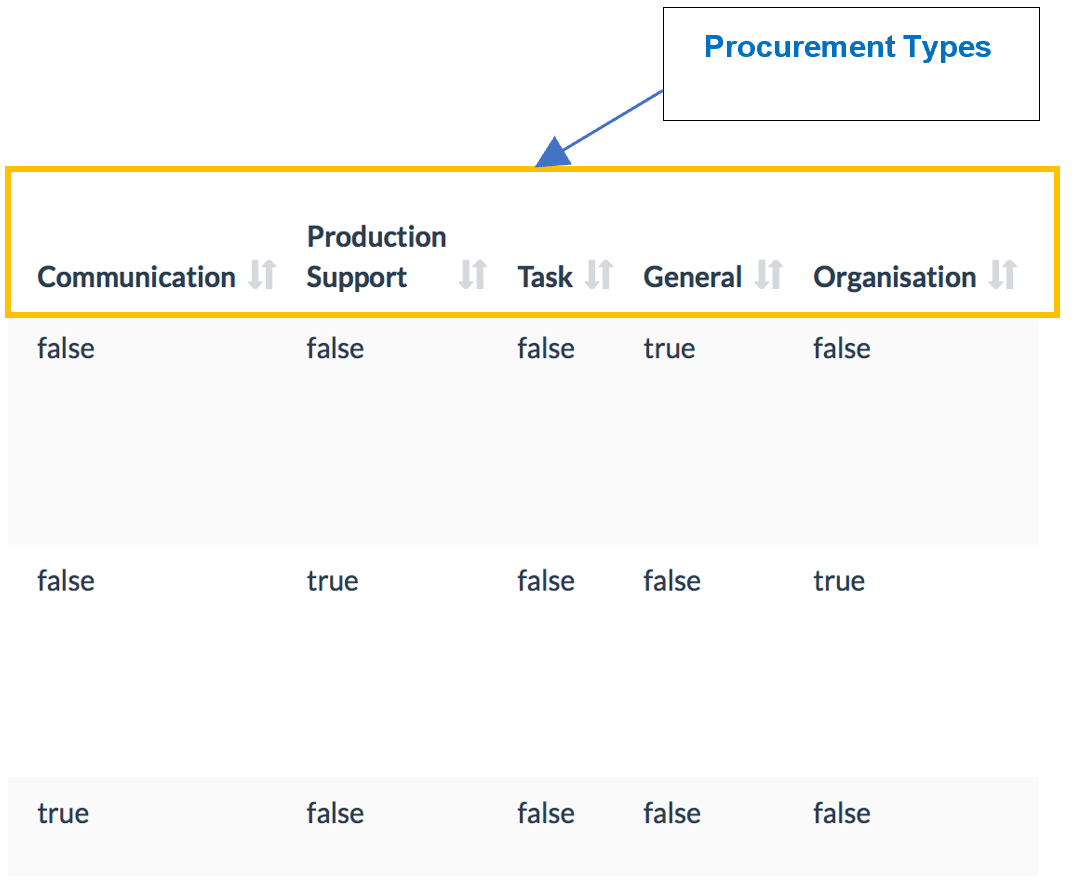
This is an additional feature which have been
added compared to the current BI systems where they use Support Vector machines
to predict multi-class labels. Here, LDA provides a probability distribution
across topics for 1 observation. This means that a procurement contract could
be multi-labelled instead. Now, we can suggest possible suppliers to invite
during the tender notification process.
With the introduction of the betweenness
centrality metric, we will now be able to identify the reliable
suppliers that many agencies and their respective ministries are
purchasing from. Using the interactive data table, one will be able uncover
that Aetos Security Management Pte. Ltd helps with the provision of armed
security personnel across government agencies.
Supplier Analysis
If we are interested to find out the Agencies
that a particular supplier has previously dealt with, we will also be able to
do so on the Supplier Network tab. This is essential for Agencies when they
would like to evaluate on potential suppliers for the tenders they have put up.
This also fosters collaboration across government Agencies where they could
garner feedback on these suppliers which aids them in their decisions.
Similarly, a data table have been included below
which will react to the filters chosen and provide the details of past
contracts if necessary.
Discussion
We presented our work at the Visual
analytics Conference and Poster Presentation held in Singapore Management
university on 12-Aug 2018. We showcased the various features of our application
and received positive comments on the capability of the Application to bring up
a Network of people associated with various ministries and suppliers.
Members of the audience were particularly
impressed by the Network Visualization and one of them commented on the layout
of the network visualization which we had, stating that this was one feature he
hasn’t seen in other relevant works using the visNetwork package for network
visualization. Also, many were amazed at the amount of visualizations possible
and the smooth interfacing in R Shiny. The audience kept reaffirming that the
whole application has been done in pure R.
Future work
Fixing the view of vizNetwork
When the betweenness scale is adjusted, the network graph’s
layout changes and it might be difficult to identify the suppliers who are not
well connected. Using igraph’s layout, we will be able to fix the layout and
adjust the filters in visNetwork. This should make it more intuitive for users
when they interact with the graph
Enhancement of Supplier Information
In the dataset, information about
supplier is only the name. It will be beneficial to add supplier information,
such as industry and financial health and performance information such as
revenue, gross profit, net profit, and change of stock price.
Utilizing the new columns created based
on LDA which indicates whether each procurement order is related to the topic,
we can filter out the dataset and analyse the pattern in network for each
topic.
The dataset includes text description,
and more useful information would be able to be extracted. Tuning of topic
modelling can be done by removing more words that disturb the output and trying
other numbers of topics and the random seed. Other techniques such as Named Entity
Recognition could be helpful as well.
Acknowledgments
The authors greatly thank Dr Tin
Seong KAM for his guidance and suggestions.
References
[1]
GeBIZ. (n.d.).
Retrieved August 8, 2018, from <a href="https://data.gov.sg/dataset?q=GeBIZ">https://data.gov.sg/dataset?q=GeBIZ</a>
[2]
Defence Science & Technology Agency,
“Business Intelligence in Government Procurement – DSTA" (n.d.). Retrieved
August 13, 2018, from <a
href="https://www.dsta.gov.sg/docs/default-source/dsta-about/business-intelligence-in-government-procurement.pdf?sfvrsn=2">https://www.dsta.gov.sg/docs/default-source/dsta-about/business-intelligence-in-government-procurement.pdf?sfvrsn=2</a>
[3]
Programmes - Civil Service College Singapore.
(2018, February 02). Retrieved August 13, 2018, from
https://www.cscollege.gov.sg/Programmes/Pages/Display
Programme.aspx?ePID=2rblsavgweogwh2qu9lgtunfma
[4]
D3treeR. (2018,
February 06) Retrieved August 8, 2018, from <a
href="https://github.com/d3treeR/d3treeR">https://github.com/d3treeR/d3treeR</a>
[5]
Sankey Diagram. (n.d.).
Retrieved August 8, 2018, from <a
href="https://plot.ly/r/sankey-diagram/">https://plot.ly/r/sankey-diagram/</a>
[6]
visNetwork
(n.d.). Retrieved August 8, 2018, from <a
href="https://datastorm-open.github.io/visNetwork/">https://datastorm-open.github.io/visNetwork/</a>
[7]
CRAN -
Package lda. (n.d.). Retrieved August 8, 2018, from <a
href="https://cran.r-project.org/web/packages/lda/">https://cran.r-project.org/web/packages/lda/</a>
[8]
LDAvis (2018,
April 25). Retrieved August 8, 2018, from <a href="https://github.com/cpsievert/LDAvis">https://github.com/cpsievert/LDAvis</a>
[9]
Betweenness Centrality (n.d). Retrieved August
6, 2018 from https://en.wikipedia.org/wiki/Betweenness_centrality


