Difference between revisions of "ISSS608 2017-18 T3 Assign Saurav Jhajharia (Data Preparation)"
Sauravj.2017 (talk | contribs) |
Sauravj.2017 (talk | contribs) |
||
| Line 48: | Line 48: | ||
The figure below depicts each of the data points mentioned above after an Exploratory Analysis of the same in JMP. | The figure below depicts each of the data points mentioned above after an Exploratory Analysis of the same in JMP. | ||
| − | [[File:Data Overview.png| | + | [[File:Data Overview.png|1000 px]] |
Revision as of 15:50, 9 July 2018
VAST Challenge 2018 MC2: Like a Duck to Water
Methodology
This problem requires us to analyze the water contamination over a 17 year period to understand if there are any shreds of evidence of possible contamination by Kasios Furniture Company. After thoroughly going through the data and understanding the problem statement, I carried out my analysis and visualization process in the following steps keeping in mind that the investigators are my clients.
1. Data Overview: Provided a summary of all the data points.
2. Data Preparation: Created differently filtered data sheets according to the requirements of the three questions asked.
3. Data Visualization: Plotted visualizations depending on the data, aesthetics, ease of understanding, and task requirements.
4. Conclusion: Drew inferences to summarize critical data evidence and pointers for the investigators to focus on.
Data Overview
The data provided to us contains the following indicators:
1. ID: This is the unique ID associated with each reading. The variable was distributed in JMP and then checked for its uniqueness to make sure that no ID is repetitive, therefore causing no duplication of ID in the dataset. There were 136824 unique samples of data collected.
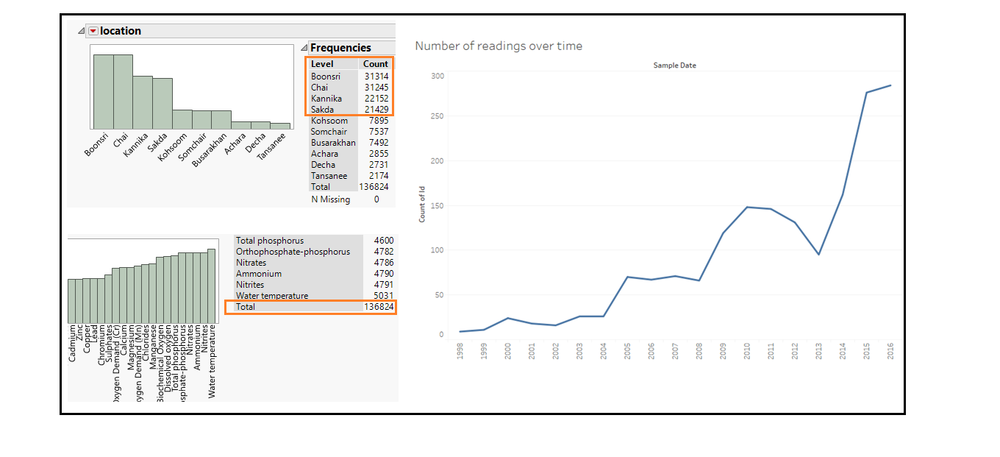
2:Sample Date: This is the date on which every sample was collected. The range of this dataset spans over 17 years. It was seen that the number of sample records collected every year for all the chemicals had grown over the years and they did not remain the same for any given two years. Most number of readings were collected in the year 2016.
3. Location : This data point indicated the location in which the specific samples of chemicals were collected, on the given date, and with the unique ID. It was seen that there were 4 locations which had more data on chemical samples were collected as compared to others. These locations were Boonsari, Chai, Kannika, and Sakda.
4. Measure : This column contains data on the name of each chemical that is associated with the specific location on that date. From a distribution of chemicals, it was seen that the highest number of readings were taken for Water Temperature, followed by Nitries and Ammonium.
The figure below depicts each of the data points mentioned above after an Exploratory Analysis of the same in JMP.
