Difference between revisions of "Group12 Overview"
Jump to navigation
Jump to search
Sameerp.2017 (talk | contribs) |
Lokeshv.2017 (talk | contribs) |
||
| (55 intermediate revisions by 2 users not shown) | |||
| Line 1: | Line 1: | ||
| − | <div style=background:# | + | <div style=background:#000000 border:#A3BFB1> |
| − | [[Image: | + | [[Image:l.gif|300px]] |
| − | <font size = 5; color="# | + | <font size = 5; font color="#FDFEFE"><span style="font-family:Lucida Sans; font-size:150%; solid #000000; background:#000000;"> Have the Nations really progressed ? <br/> </span></font> |
</div> | </div> | ||
| − | <!-- | + | <!--NAV BAR --> |
| − | {|style="background-color:# | + | {|style="background-color:#F44336;" width="100%" cellspacing="0" cellpadding="0" valign="top" border="3" | |
| − | | style="font-family: | + | | style="font-family:Tahoma; font-size:125%; solid #1B338F; background:#000000; text-align:center;" width="16.66%" | |
; | ; | ||
| − | [[Group12_Proposal| <font color="# | + | [[Group12_Overview| <font color="#FDFEFE">About Us</font>]] |
| + | |||
| + | | style="font-family:Tahoma; font-size:115%; solid #1B338F; background:#000000; text-align:center;" width="16.66%" | | ||
| + | ; | ||
| + | [[Group12_Proposal| <font color="#FDFEFE">Proposal</font>]] | ||
| − | | style="font-family: | + | | style="font-family:Tahoma; font-size:115%; solid #1B338F; background:#000000; text-align:center;" width="16.66%" | |
; | ; | ||
| − | [[Group12_Poster| <font color="# | + | [[Group12_Poster| <font color="#FDFEFE">Poster</font>]] |
| − | | style="font-family: | + | | style="font-family:Tahoma; font-size:115%; solid #1B338F; background:#000000; text-align:center;" width="16.66%" | |
; | ; | ||
| − | [[Group12_Application| <font color="# | + | [[Group12_Application| <font color="#FDFEFE">Application</font>]] |
| − | | style="font-family: | + | | style="font-family:Tahoma; font-size:115%; solid #1B338F; background:#000000; text-align:center;" width="16.66%" | |
; | ; | ||
| − | [[Group12_Report| <font color="# | + | [[Group12_Report| <font color="#FDFEFE">Report</font>]] |
| − | | style="font-family: | + | | style="font-family:Tahoma; font-size:115%; solid #1B338F; background:#000000; text-align:center;" width="16.66%" | |
; | ; | ||
| − | [https://wiki.smu.edu.sg/1718t3isss608/Project_Groups <font color="# | + | [https://wiki.smu.edu.sg/1718t3isss608/Project_Groups <font color="#FDFEFE">Project Groups</font>] |
| − | | | + | | |
|} | |} | ||
| − | |||
| − | == | + | <div style="text-align:center; padding-top:25px;"> |
| − | <br/> | + | ==<span style="font-size:24px;">'''Introduction'''</span>== |
| + | </div> | ||
| + | <div style="text-align:center; padding-top:25px;"> | ||
| + | <span style="font-size:14px;">Welcome to Team 12’s wiki page for ISSS608: Visual Analytics and Applications - group project.</span> | ||
| + | </div> | ||
| + | <div style="text-align:center;"> | ||
| + | <span style="font-size:14px;">This is our cover page, which gives you the first step access to our project proposal and view our final project output once ready.</span> | ||
| + | </div> | ||
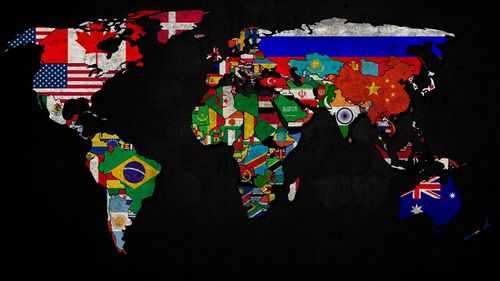
| + | [[Image:nations.jpg|center|500px]] | ||
| + | <span style="font-size:14px;"> | ||
| + | <br/>Our project focuses on the analysis of statistics from all the countries in the world. With this data we want to better understand the progress they have made for over five decades. Our aim is to create an interactive dashboard for the concerned stakeholders to receive adequate information over the past and present states of different nations. With this data, they can better interpret and re-adjust the immediate requirements and predict future needs for the concerned countries.</span> | ||
| − | == | + | <!--INTRODUCTION --> |
| − | < | + | <!--OUR TEAM--> |
| − | < | + | <div style="text-align:center;vertical-align:bottom;padding-top:10px;"> |
| − | < | + | <span style="font-size:14px;"><u>Our Team</u></span> |
| − | + | </div> | |
| − | == | + | {|style="background-color:#F44336;" width="100%" cellspacing="0" cellpadding="0" valign="top" border="3" | |
| − | < | + | | style="font-family:Tahoma; font-size:125%; solid #1B338F; background:#FDFEFE; text-align:center;" width="33.33%" | |
| − | <br/> | + | <div style="text-align:center; padding-top:10px;"> |
| − | + | [[File:link.jpg|40px|link=https://www.linkedin.com/in/sudhirpanda/]]<br/> | |
| − | = | + | <span style="font-size:13px;">[https://www.linkedin.com/in/sudhirpanda/| Sudhir Panda]</span> |
| − | < | + | </div> |
| − | + | | style="font-family:Tahoma; font-size:125%; solid #1B338F; background:#FDFEFE; text-align:center;" width="33.33%" | | |
| − | == | + | <div style="text-align:center; padding-top:10px;"> |
| − | <br/> | + | [[File:link.jpg|40px|link=https://www.linkedin.com/in/lokeshvm/]]<br/> |
| − | < | + | <span style="font-size:13px;">[https://www.linkedin.com/in/lokeshvm/| Lokesh Vairamuthu]</span> |
| − | + | </div> | |
| − | == | + | | style="font-family:Tahoma; font-size:125%; solid #1B338F; background:#FDFEFE; text-align:center;" width="33.33%" | |
| − | <br/> | + | <div style="text-align:center; padding-top:10px;"> |
| − | < | + | [[File:link.jpg|40px|link=https://www.linkedin.com/in/pandasameer/]]<br/> |
| − | < | + | <span style="font-size:13px;">[https://www.linkedin.com/in/pandasameer/| Sameer Panda]</span> |
| + | </div> | ||
Latest revision as of 03:04, 15 August 2018
|
|
|
|
|
|
|
Introduction
Welcome to Team 12’s wiki page for ISSS608: Visual Analytics and Applications - group project.
This is our cover page, which gives you the first step access to our project proposal and view our final project output once ready.
Our project focuses on the analysis of statistics from all the countries in the world. With this data we want to better understand the progress they have made for over five decades. Our aim is to create an interactive dashboard for the concerned stakeholders to receive adequate information over the past and present states of different nations. With this data, they can better interpret and re-adjust the immediate requirements and predict future needs for the concerned countries.
Our Team

