Difference between revisions of "ISSS608 2017-18 T3 Assign See Kwan Yen Visualization"
| (15 intermediate revisions by the same user not shown) | |||
| Line 1: | Line 1: | ||
| − | == | + | ==Trends: Do you see any trends of possible interest in this investigation?== |
<table border='1'> | <table border='1'> | ||
<tr> | <tr> | ||
| Line 29: | Line 29: | ||
</tr> | </tr> | ||
<tr> | <tr> | ||
| − | <td><b> 2. | + | <td><b> 2. Chemicals by Locations</b> |
| − | <br> | + | <br>Since Iron has the highest level previously, figure 1.3 shows the trend of Iron across all locations. Iron had been consistently low for Boonsri, Busarakhan, Chai, Kannika, Kohsoom, Sakda, and Somchair. Kohsoom has the highest level of Iron among all locations. It is almost non-existent in Achara, Decha and Tansanee. |
| − | |||
| − | |||
| − | |||
| − | |||
| − | |||
| − | + | However, a spike in the value of Iron is observed among 6 of the locations as shown in chart. | |
| − | + | Investigating further on 2003 period shows that values Copper have also spiked during the same day for Kohsoom. | |
| − | |||
| − | |||
| − | + | While we do not know the cause, the correlation of such values seem to suggest a contamination incident around that period.</td> | |
| − | < | ||
| − | |||
| − | < | + | <td> |
| + | [[File:MapChemical2.png|600px|center]] | ||
</td> | </td> | ||
| − | |||
</tr> | </tr> | ||
<tr> | <tr> | ||
| − | <td><b> | + | |
| − | <br>In figure 1.4, Arsenic has | + | <td><b> 3. Measure Insight - Increasing presence of Arsenic</b> |
| − | <td>[[File: | + | <br>In figure 1.4, Arsenic has seen an increasing trend across many locations. Further investigation as to the possible cause of such continuous growth would be advised as to prevent the ecosystem of the waterways and the habitat from being contaminated further.</td> |
| + | <td> | ||
| + | [[File:Arsenic.png|600px|center]] | ||
| + | </td> | ||
</tr> | </tr> | ||
<tr> | <tr> | ||
| − | <td><b> | + | <td><b> 4. Location Insight - Achara & Kohssom</b> |
| − | <br> | + | <br> There is an elevated level of Mercury in Achara in 2010 to 2011. Prior to that, there is no data for Mercury in this location. Kohsoom also saw an increased level of mercury in 2006. </td> |
| − | <td>[[File: | + | <td> |
| + | [[File:Mercury.png|600px|center]] | ||
| + | </td> | ||
</tr> | </tr> | ||
<tr> | <tr> | ||
| − | + | </table> | |
| − | |||
| − | + | ==Anomalies: What anomalies do you find in the waterway samples dataset? How do these affect your analysis of potential problems to the environment? Is the Hydrology Department collecting sufficient data to understand the comprehensive situation across the Preserve? What changes would you propose to make in the sampling approach to best understand the situation? == | |
| + | |||
| + | <table> | ||
| + | <table border='1'> | ||
| + | <th>Patterns</th> | ||
| + | <th>Visualization</th> | ||
| + | <tr> | ||
| + | <td> <b> 1. Missing data for specific years and locations </b> | ||
| + | <br> The figure 2.1 provides a clear view of missing samples of Sulphates and uneven sampling. This is a cause of major concern. We can clearly see that are missing values for samples in Achara, Decha and Tansanee. Plus a very low level of samples taken in those sites compared to the other locations. At the same time, we can appreciate a high level of samples in Boonsri, Chai, Kannika, Sakda specially in a range of years from 2002 to 2009. This scenario occurred for many other chemicals too. </td> | ||
| + | <td> | ||
| + | [[File:Heatmapcpunt.png|600px|center]] | ||
</td> | </td> | ||
| − | |||
| − | |||
</tr> | </tr> | ||
<tr> | <tr> | ||
| − | <td><b> | + | <td> <b> 2.Methylosmoline reading started from 2014 onwards but inconsistent </b> |
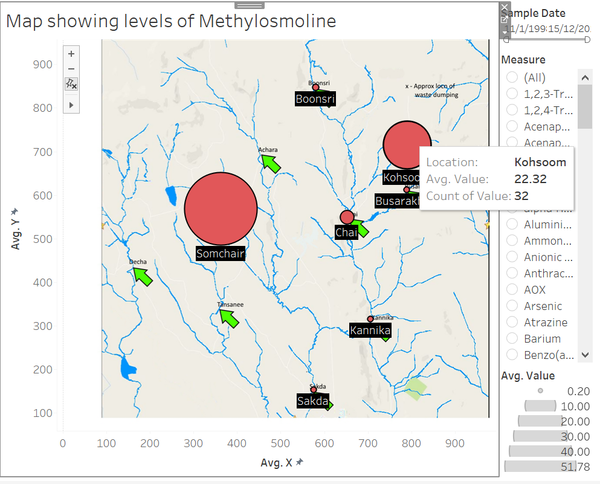
| − | + | <br>Methylosmoline is the major contaminant chemical. However, there are only 3 years of samples available: 2014, 2015 and 2016. The sampling distribution of Methylosmoline varies across the locations. We can possibly traced it back to when Kasios started setting up its factories in the area and also when they started producing Methylosmoline. There is a high probability that if they coincide, then Kasios is highly probable to be found guilty of the production of Methylosmoline. | |
| + | |||
| + | <td>[[File:Boxplot2.JPG|600px|center]]</td> | ||
| + | </tr> | ||
| + | <tr> | ||
| + | <td> <b>3.Other chemicals have uneven distributions in different locations </b> | ||
| + | <br> The figure shows Aluminium and Iron distributions of samples taken by locations, as we can see they are very differently distributed with outliers clearly marked in locations like Chai or Boonsri </td> | ||
| + | <td> | ||
| + | [[File:BoxAluminium.png|300px|left]] | ||
| + | |||
| + | |||
| + | [[File:Boxcount.png|300px|right]] | ||
| + | </td> | ||
| + | </tr> | ||
| − | + | </table> | |
| + | ==Causes of concern: do any of your findings cause particular concern for the Pipit or other wildlife? Would you suggest any changes in the sampling strategy to better understand the waterways situation in the Preserve? == | ||
| − | + | <br> | |
| + | <table> | ||
| + | <table border='1'> | ||
| + | <tr> | ||
| + | <th> Causes of Concern </th> | ||
| + | <th>Visualization</th> | ||
| + | </tr> | ||
| + | <tr> | ||
| + | <td> | ||
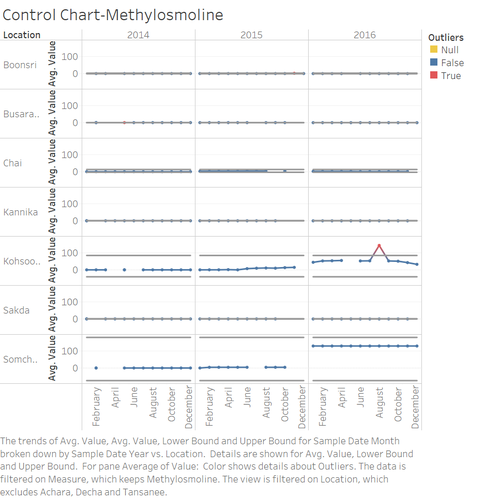
| + | <br> A major cause of concern is the average values of Methylosmoline in locations nearby the dumping site. I have created a control chart to represent outliers in 1,2 or 3 standard deviations and show specific outliers in the data. | ||
| + | <td>The figure below shows the outliers of 2 standard deviation of Methylosmoline in Kohsoom. | ||
| + | [[File:Control chart.png|500px|center]]</td> | ||
| + | </tr> | ||
| + | <tr> | ||
| + | <td> Suggestions for sampling strategy: | ||
| + | <br>1. I suggest that we should regularly check and maintain the sensors in those locations, as some missing data could be caused by impairment of the hardware. <br> 2.Also, the number of times a reading is performed need to be consistent in the same river source, so that we can compare the data across the locations in that same area. <br> 3.We should focus on 3 groups: a main group comprising Area 4 - Boonsri - Kohsoom - Busarakhan - Chai and Kannika. A second group comprising joined locations in the river in Area 3 like Achara, Somchair,Sakda. A third group comprising: Decha and Tansanee. This way we could understand the impact of chemicals from one location flowing to other locations down the rivers. | ||
| + | <td> | ||
| + | [[File:Riversource.png|600px|center]] | ||
| + | </td> | ||
| + | </tr> | ||
| − | + | <tr> | |
| + | <td> Levels of Methylosmoline detected across different days of a week | ||
| + | <br> The cycle plot beside shows that the readings in Somchair usually hit a peak (darker green shade) on weekend, especially Sundays. Also noticed that Kohsoom has higher than usual amount of Methylosmoline on Thursday. Interestingly, the readings in Somchair are close to zero on the same day. This pattern certainly raise suspicion that Kasios is trying to avoid detection by relevant authorities on weekdays and only produce the harmful chemical on weekends in Somchair. However, there is a high chance that the waste was dumped at Kohsoom instead on Thursday. | ||
| + | <td> | ||
| + | [[File:Timing1.png|800px|center]] | ||
</td> | </td> | ||
| − | |||
| − | |||
</tr> | </tr> | ||
| + | </table> | ||
| + | |||
| + | <table> | ||
| + | <table border='1'> | ||
| + | <tr> | ||
| + | |||
| + | </tr> | ||
| + | <tr> | ||
| + | |||
</table> | </table> | ||
Latest revision as of 01:13, 9 July 2018
Trends: Do you see any trends of possible interest in this investigation?
| Patterns | Visualization |
|---|---|
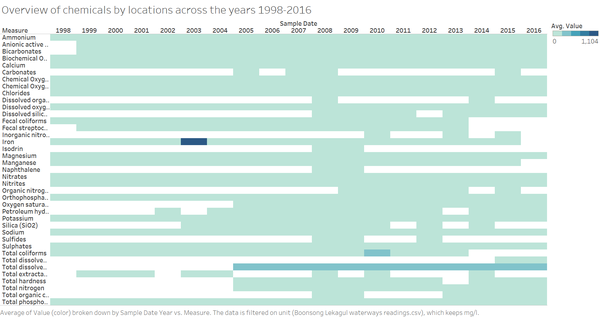
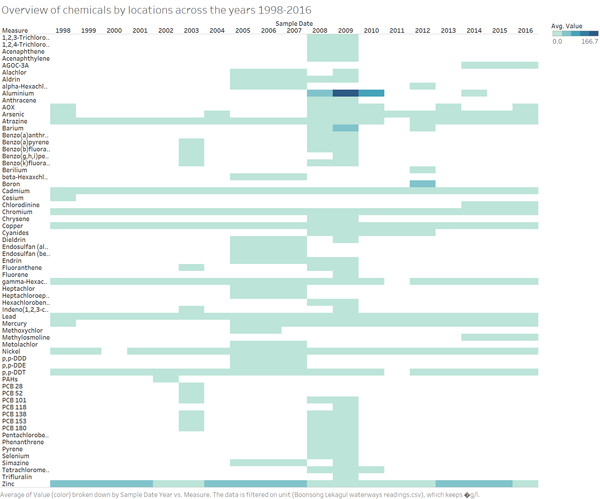
| 1. Overview of chemical tracking across the Years
An overview of the water sensor readings across the years will give us a snapshot of the level of chemicals in the wwterway.
|
|
| 2. Chemicals by Locations
However, a spike in the value of Iron is observed among 6 of the locations as shown in chart. Investigating further on 2003 period shows that values Copper have also spiked during the same day for Kohsoom. While we do not know the cause, the correlation of such values seem to suggest a contamination incident around that period. |
|
| 3. Measure Insight - Increasing presence of Arsenic
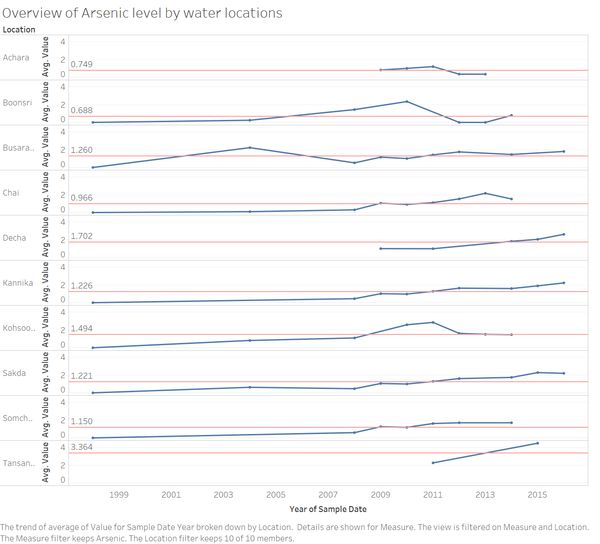
In figure 1.4, Arsenic has seen an increasing trend across many locations. Further investigation as to the possible cause of such continuous growth would be advised as to prevent the ecosystem of the waterways and the habitat from being contaminated further. |
|
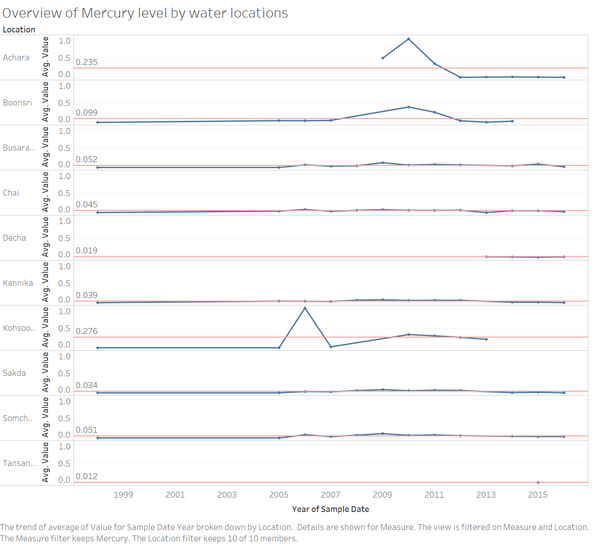
| 4. Location Insight - Achara & Kohssom
There is an elevated level of Mercury in Achara in 2010 to 2011. Prior to that, there is no data for Mercury in this location. Kohsoom also saw an increased level of mercury in 2006. |
|
Anomalies: What anomalies do you find in the waterway samples dataset? How do these affect your analysis of potential problems to the environment? Is the Hydrology Department collecting sufficient data to understand the comprehensive situation across the Preserve? What changes would you propose to make in the sampling approach to best understand the situation?
| Patterns | Visualization |
|---|---|
| 1. Missing data for specific years and locations
The figure 2.1 provides a clear view of missing samples of Sulphates and uneven sampling. This is a cause of major concern. We can clearly see that are missing values for samples in Achara, Decha and Tansanee. Plus a very low level of samples taken in those sites compared to the other locations. At the same time, we can appreciate a high level of samples in Boonsri, Chai, Kannika, Sakda specially in a range of years from 2002 to 2009. This scenario occurred for many other chemicals too. |
|
| 2.Methylosmoline reading started from 2014 onwards but inconsistent
| |
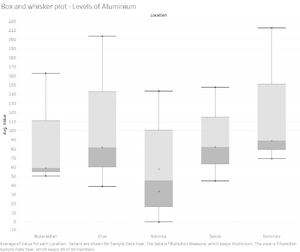
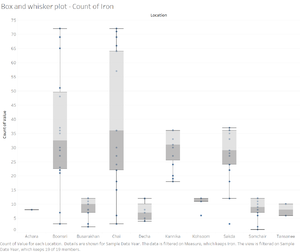
| 3.Other chemicals have uneven distributions in different locations
The figure shows Aluminium and Iron distributions of samples taken by locations, as we can see they are very differently distributed with outliers clearly marked in locations like Chai or Boonsri |
|
Causes of concern: do any of your findings cause particular concern for the Pipit or other wildlife? Would you suggest any changes in the sampling strategy to better understand the waterways situation in the Preserve?
| Causes of Concern | Visualization |
|---|---|
|
| The figure below shows the outliers of 2 standard deviation of Methylosmoline in Kohsoom. |
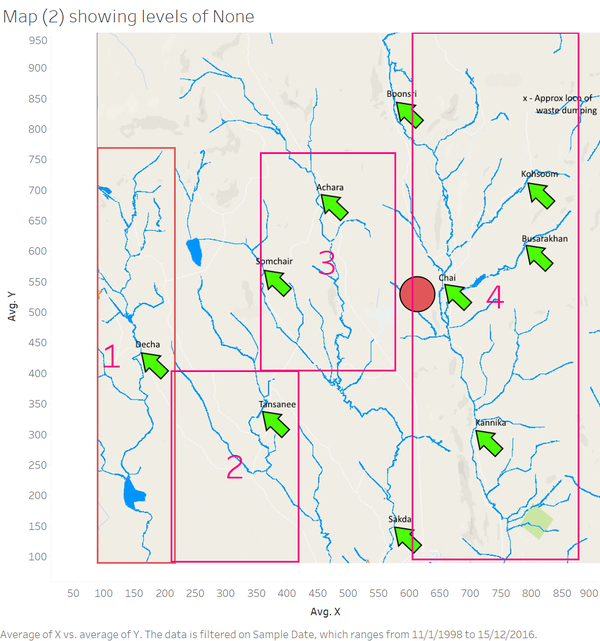
| Suggestions for sampling strategy:
| |
| Levels of Methylosmoline detected across different days of a week
|
