Difference between revisions of "ISSS608 2017-18 T3 Assign Joel Choo Peng Yeow Are You Guilty"
| (13 intermediate revisions by the same user not shown) | |||
| Line 37: | Line 37: | ||
==<font size="5"><font color="#000000">'''Do You Plead Guilty?"'''</font></font>== | ==<font size="5"><font color="#000000">'''Do You Plead Guilty?"'''</font></font>== | ||
| − | === | + | ===Data Preperation=== |
Using the list of suspects provided by the insider, we would like to determine if anyone else appears to be closely related to the group and which employees are making suspicious purchase. The below depicts the original network of the list of suspicious individuals provided by the insider. The size of nodes and node labels indicates the in-degree each node appears within the dataset. Larger node represents that many edges go in the node and communications are directed at them. | Using the list of suspects provided by the insider, we would like to determine if anyone else appears to be closely related to the group and which employees are making suspicious purchase. The below depicts the original network of the list of suspicious individuals provided by the insider. The size of nodes and node labels indicates the in-degree each node appears within the dataset. Larger node represents that many edges go in the node and communications are directed at them. | ||
| Line 51: | Line 51: | ||
<hr/> | <hr/> | ||
| − | === | + | ===Understanding Centrality Measures=== |
In a connected graph, closeness centrality (or closeness) of a node is a measure of centrality in a network, calculated as the sum of the length of the shortest paths between the node and all other nodes in the graph. Thus the more central a node is, the closer it is to all other nodes. We will use this metric to identify who are close to the group of suspects. | In a connected graph, closeness centrality (or closeness) of a node is a measure of centrality in a network, calculated as the sum of the length of the shortest paths between the node and all other nodes in the graph. Thus the more central a node is, the closer it is to all other nodes. We will use this metric to identify who are close to the group of suspects. | ||
| Line 61: | Line 61: | ||
<hr/> | <hr/> | ||
| − | === | + | ===Solving The Crime=== |
| − | ===== | + | =====Finding Those Who Are Close And Crucial To The Group ===== |
Using '''closeness''' as the size of a node, we have obtained a network with many who seem to be close to the suspicious group. 896 nodes remain on the filtered graph and we will use them to find out their interactions over time.<br><br> | Using '''closeness''' as the size of a node, we have obtained a network with many who seem to be close to the suspicious group. 896 nodes remain on the filtered graph and we will use them to find out their interactions over time.<br><br> | ||
[[File:Joel Closeness transition.png|950px]]<br> | [[File:Joel Closeness transition.png|950px]]<br> | ||
| Line 76: | Line 76: | ||
[[File:Joel Betweeness.png|700px]] | [[File:Joel Betweeness.png|700px]] | ||
| − | ===== | + | =====Suspicious Purchases ===== |
Coincidentally, the bulk of purchase orders were made by the big 4 as well, Tobi, Meryl, Lizbeth and the bulk came from Richard with a total of 15 purchases. This should not be a coincidence and further investigations should definitely be conducted on the four of them. | Coincidentally, the bulk of purchase orders were made by the big 4 as well, Tobi, Meryl, Lizbeth and the bulk came from Richard with a total of 15 purchases. This should not be a coincidence and further investigations should definitely be conducted on the four of them. | ||
<br><br> | <br><br> | ||
[[File:Suspicious purchases.png|700px]] | [[File:Suspicious purchases.png|700px]] | ||
| − | === | + | ===How Have The Organisational Structure & Communications Changed Over Time?=== |
| − | |||
| − | |||
| − | |||
| − | |||
| − | |||
| − | |||
| − | |||
| − | |||
| − | |||
| − | |||
| − | |||
| − | |||
| − | |||
| − | |||
| − | |||
| − | |||
| − | |||
| − | |||
| − | |||
| − | |||
| − | |||
| − | |||
| − | |||
| − | |||
| − | |||
| − | |||
| − | |||
| − | |||
| − | |||
| − | |||
{| class="wikitable" style="background-color:#FFFFFF;" width="100%" | {| class="wikitable" style="background-color:#FFFFFF;" width="100%" | ||
|- | |- | ||
| | | | ||
| − | <b> | + | <b>Period</b> |
|| | || | ||
| − | <b> | + | <b>Description</b> |
|| | || | ||
| − | <b> | + | <b>Graph</b> |
|- | |- | ||
| | | | ||
| − | + | Jul 2015 | |
| − | |||
| − | |||
| − | |||
| − | |||
| − | |||
| − | |||
| − | |||
| − | |||
| − | |||
| − | |||
| − | |||
| − | |||
| − | |||
| − | |||
| − | |||
| − | |||
| − | |||
| − | |||
| − | |||
| − | |||
| − | |||
| − | |||
| − | |||
| − | |||
| − | |||
| − | |||
| − | |||
| − | |||
| − | |||
| − | |||
| − | |||
| − | |||
| − | |||
| − | |||
| − | |||
| − | |||
| − | |||
| − | |||
| − | |||
| − | |||
| − | |||
| − | |||
| − | |||
| − | |||
| − | |||
| − | |||
| − | |||
| − | |||
| − | |||
| − | |||
| − | |||
| − | |||
| − | |||
| − | |||
| − | |||
| − | |||
| − | |||
| − | |||
| − | |||
| − | |||
| − | |||
| − | |||
| − | |||
| − | |||
| − | |||
| − | |||
| − | |||
| − | |||
| − | |||
| − | |||
| − | |||
| − | |||
| − | |||
| − | |||
| − | |||
| − | |||
| − | |||
| − | |||
| − | |||
| − | |||
|| | || | ||
| − | + | During the initial stage of the organisation in 2015, there isn't much communication and '''Richard Fox, Tob Gatlin, Maryl Pastuch''' each communicate within their teams. The first purchase was also made by '''Richard Fox''', a significant role player within the network and organisation. | |
|| | || | ||
| − | [[File: | + | [[File:1 Jul 2015 First Puchase.png|500px]] |
|- | |- | ||
| | | | ||
| − | + | Aug 2015 | |
|| | || | ||
| − | + | This was the first contact made across teams. '''Meryl''' and '''Richard''' both purchased from '''Gail Feindt''' and '''Timothy Gibson''' was probably involved in the "handshake" across teams. | |
|| | || | ||
| − | [[File: | + | [[File:2 Aug 2015 Maryl and Richard introduced.png|500px]] |
|- | |- | ||
| | | | ||
| − | + | Sep 2015 | |
|| | || | ||
| − | + | '''Tobi Gatlin''' made his first purchased from '''Gail''' and since '''Richard''' have yet to contact '''Tobi''', '''Gail''' being the point of contact could have introduced them. | |
|| | || | ||
| − | [[File: | + | [[File:3 Sep 2015 Tobi and Richard introduced.png|500px]] |
| − | |||
|- | |- | ||
| | | | ||
| − | + | Early Oct 2015 | |
|| | || | ||
| − | + | '''Richard Fox''' set up a first meeting with '''Meryl''' | |
|| | || | ||
| − | [[File: | + | [[File:4 Oct 2015 Richard meet Meryl.png|500px]] |
| − | |||
|- | |- | ||
| | | | ||
| − | + | Late Oct 2015 | |
|| | || | ||
| − | + | A huge meeting was conducted and surprisingly, these were the only people who were involved in meetings throughout the years. They were probably mid-management and should be investigated since most of the information gets pass down through them. | |
|| | || | ||
| − | [[File: | + | [[File:Joel Meetings.png|500px]] |
|- | |- | ||
| | | | ||
| − | + | Nov 2015 | |
|| | || | ||
| − | + | '''Madeline Nindorf''' calls '''Lizbeth Jindra''' and this was the first encounter where '''Lizbeth''' has been brought into the saga. Oddly, '''Madeline''' Calls '''Lizbeth''' every Oct to Dec for the next few years. Its seems like '''Madeline''' is the point of contact with the rest of the suspicious group. | |
|| | || | ||
| − | [[File: | + | [[File:6 Nov 2015 Madelino Call Lizbeth and start communicating.png|500px]] |
|- | |- | ||
| | | | ||
| − | + | Apr 2016 | |
|| | || | ||
| − | + | After a major meeting between '''Richard, Kerstin Belveal, and Meryl''' a purchase was made. | |
|| | || | ||
| − | [[File: | + | [[File:7. Apr 2016 Meetings and purchase.png|500px]] |
|- | |- | ||
| | | | ||
| − | + | End 2016 | |
|| | || | ||
| − | + | Madeline Nindorf seems to be the point of contact and the bridge between '''Meryl and Lizbeth''' since '''Meryl and Lizbeth''' do not have any modes of communication thus far. | |
|| | || | ||
| − | [[File: | + | [[File:8 end 2016 Madeline Nindorf bridge between Meryl and Lizbeth.png|500px]] |
|- | |- | ||
| | | | ||
| − | + | Nov 2016 | |
|| | || | ||
| − | + | This is '''Libeth's''' first purchase from '''Gail''' after the many meetings and encounters with the rest of the group through '''Madeline'''. Again, '''Madeline''' could be seen calling '''Lizbeth''' during the end of year period. | |
|| | || | ||
| − | [[File: | + | [[File:9 Nov 2016 Mar 2017 Lizbeth first purchase.png|500px]] |
|} | |} | ||
<br> | <br> | ||
| − | |||
| − | |||
| − | |||
| − | |||
| − | |||
| − | |||
| − | |||
| − | |||
| − | |||
| − | |||
| − | |||
| − | |||
| − | |||
| − | |||
| − | |||
| − | |||
| − | |||
| − | |||
| − | |||
| − | |||
| − | |||
| − | |||
| − | |||
| − | |||
| − | |||
| − | |||
| − | |||
| − | |||
| − | |||
| − | |||
| − | |||
| − | |||
| − | |||
| − | |||
| − | |||
| − | |||
| − | |||
| − | |||
| − | |||
| − | |||
| − | |||
| − | |||
| − | |||
| − | |||
| − | |||
| − | |||
| − | |||
| − | |||
| − | |||
| − | |||
| − | |||
| − | |||
| − | |||
| − | |||
| − | |||
| − | |||
| − | |||
| − | |||
| − | |||
| − | |||
| − | |||
| − | |||
| − | |||
| − | |||
| − | |||
| − | |||
| − | |||
| − | |||
| − | |||
| − | |||
| − | |||
| − | |||
| − | |||
| − | |||
| − | |||
| − | |||
| − | |||
| − | |||
| − | |||
| − | |||
| − | |||
| − | |||
| − | |||
| − | |||
| − | |||
| − | |||
| − | |||
| − | |||
| − | |||
| − | |||
| − | |||
| − | |||
| − | |||
| − | |||
| − | |||
| − | |||
| − | |||
| − | |||
| − | |||
| − | |||
| − | |||
| − | |||
| − | |||
| − | |||
| − | |||
| − | |||
| − | |||
| − | |||
| − | |||
| − | |||
| − | |||
| − | |||
| − | |||
| − | |||
| − | |||
| − | |||
| − | |||
| − | |||
| − | |||
| − | |||
| − | |||
| − | |||
| − | |||
| − | |||
| − | |||
| − | |||
| − | |||
| − | |||
| − | |||
| − | |||
| − | |||
| − | |||
| − | |||
| − | |||
| − | |||
| − | |||
| − | |||
| − | |||
| − | |||
| − | |||
| − | |||
| − | |||
| − | |||
| − | |||
| − | |||
| − | |||
| − | |||
| − | |||
| − | |||
| − | |||
| − | |||
| − | |||
| − | |||
| − | |||
| − | |||
| − | |||
| − | |||
| − | |||
| − | |||
| − | |||
| − | |||
| − | |||
| − | |||
| − | |||
| − | |||
| − | |||
| − | |||
| − | |||
| − | |||
| − | |||
| − | |||
| − | |||
| − | |||
| − | |||
| − | |||
| − | |||
| − | |||
| − | |||
| − | |||
| − | |||
| − | |||
| − | |||
| − | |||
| − | |||
| − | |||
| − | |||
| − | |||
| − | |||
| − | |||
| − | |||
| − | |||
| − | |||
| − | |||
| − | |||
| − | |||
| − | |||
| − | |||
| − | |||
| − | |||
| − | |||
| − | |||
| − | |||
| − | |||
| − | |||
| − | |||
| − | |||
| − | |||
| − | |||
| − | |||
| − | |||
| − | |||
| − | |||
| − | |||
| − | |||
| − | |||
| − | |||
| − | |||
| − | |||
| − | |||
| − | |||
| − | |||
| − | |||
| − | |||
| − | |||
| − | |||
| − | |||
| − | |||
| − | |||
| − | |||
| − | |||
| − | |||
| − | |||
| − | |||
| − | |||
| − | |||
| − | |||
| − | |||
| − | |||
| − | |||
| − | |||
| − | |||
| − | |||
| − | |||
| − | |||
| − | |||
| − | |||
| − | |||
| − | |||
| − | |||
| − | |||
| − | |||
| − | |||
| − | |||
| − | |||
| − | |||
| − | |||
| − | |||
| − | |||
| − | |||
| − | |||
| − | |||
| − | |||
| − | |||
| − | |||
| − | |||
| − | |||
| − | |||
| − | |||
| − | |||
| − | |||
| − | |||
| − | |||
| − | |||
Latest revision as of 21:20, 8 July 2018
"You See, But You Do Not Observe"
- Sherlock
Looking Deeper Into The Network Of Connected Individuals
|
|
|
|
|
|
|
Contents
Do You Plead Guilty?"
Data Preperation
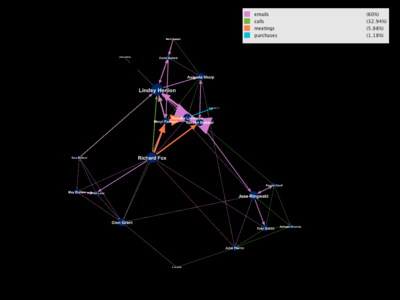
Using the list of suspects provided by the insider, we would like to determine if anyone else appears to be closely related to the group and which employees are making suspicious purchase. The below depicts the original network of the list of suspicious individuals provided by the insider. The size of nodes and node labels indicates the in-degree each node appears within the dataset. Larger node represents that many edges go in the node and communications are directed at them.
Lindsy Henion, Richard Fox and Jose Ringwalk seems to be the prominent ones here and we will investigate further.
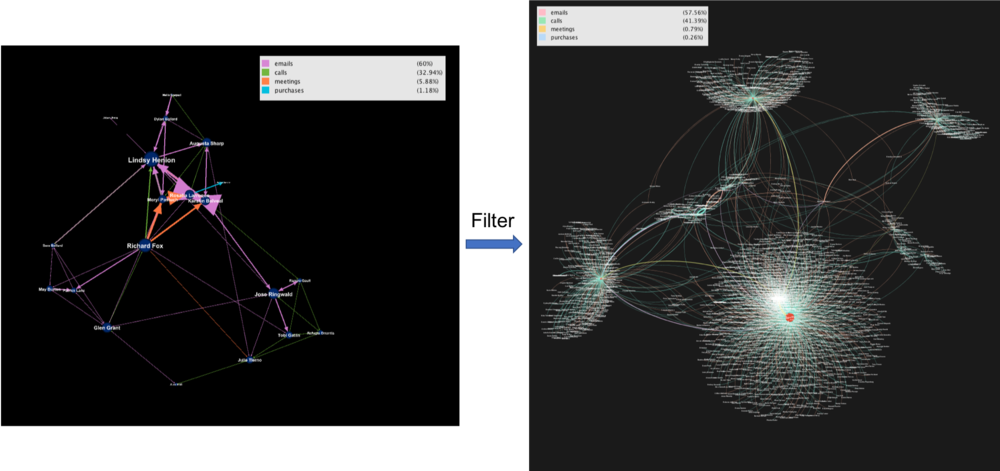
After filtering all activities that happened in the company, we obtain 1722 employees (nodes) and 1904 activities (edges) as seen below.
Understanding Centrality Measures
In a connected graph, closeness centrality (or closeness) of a node is a measure of centrality in a network, calculated as the sum of the length of the shortest paths between the node and all other nodes in the graph. Thus the more central a node is, the closer it is to all other nodes. We will use this metric to identify who are close to the group of suspects.
Betweeness on the other hand represents the degree of which nodes stand between each other and high betweenness means more information will pass through that node. Removing the node will lose a large part of the graph.
After running the algorithm in Gephi, we obtain the centrality measures. Betweeness are skewed right and lesser observations have a high betweenness. Closeness on the other hand are distributed more evenly and we would expect many employees to be closely connected.
Solving The Crime
Finding Those Who Are Close And Crucial To The Group
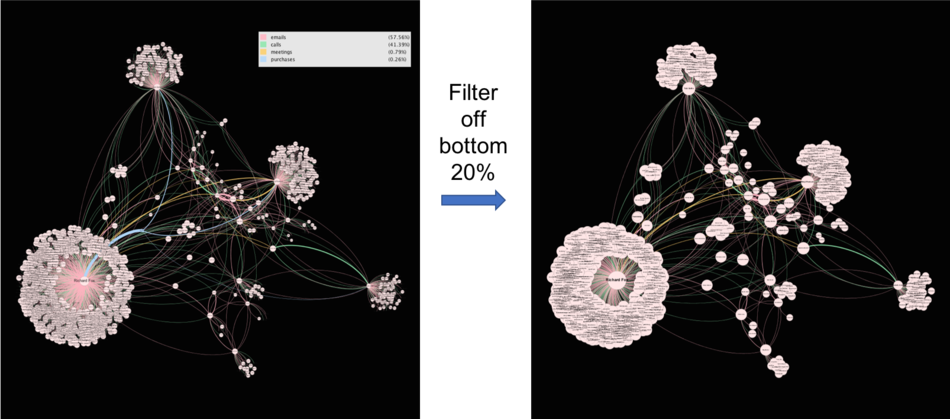
Using closeness as the size of a node, we have obtained a network with many who seem to be close to the suspicious group. 896 nodes remain on the filtered graph and we will use them to find out their interactions over time.
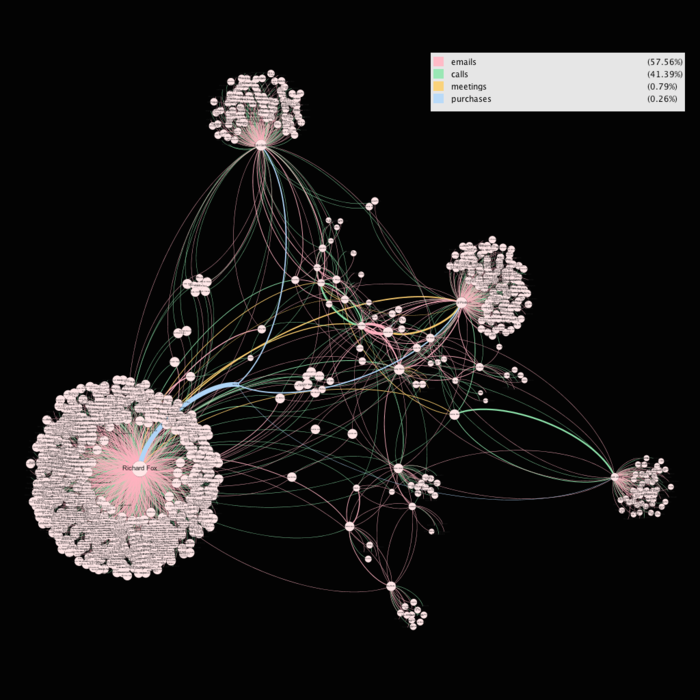
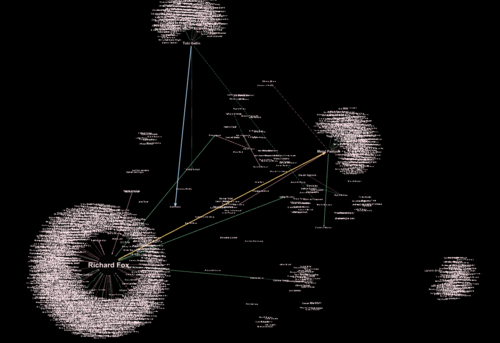
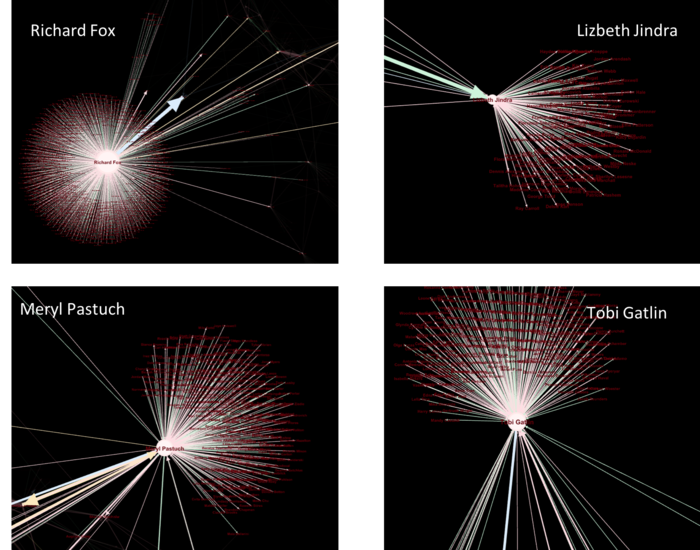
With betweenness as the size of the node, there are 4 big players in the company and they are likely to be very influential people.
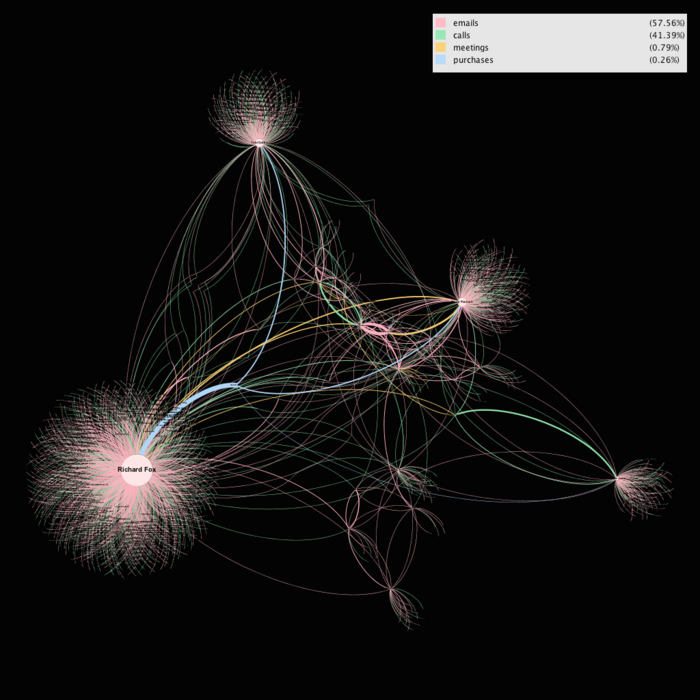
An Overview of the network graph shows how important the big 4 is to the company with betweenness as a centrality measure.
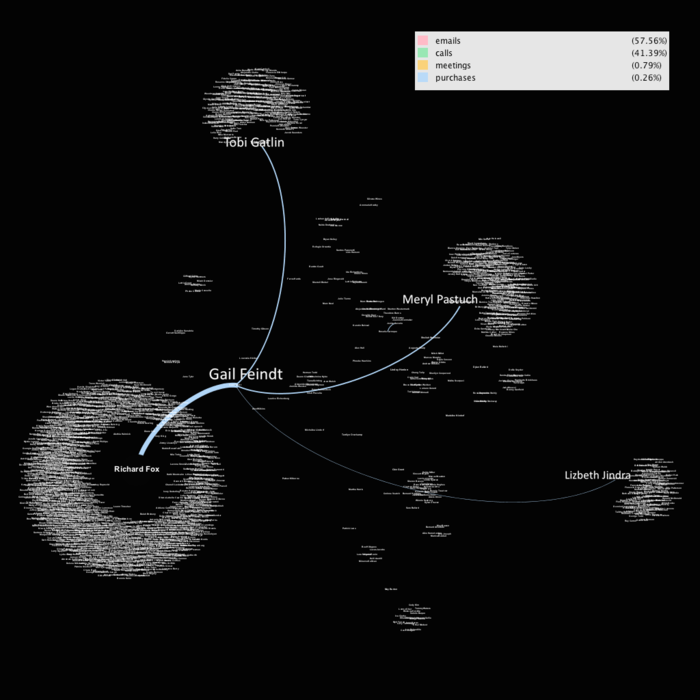
Suspicious Purchases
Coincidentally, the bulk of purchase orders were made by the big 4 as well, Tobi, Meryl, Lizbeth and the bulk came from Richard with a total of 15 purchases. This should not be a coincidence and further investigations should definitely be conducted on the four of them.
How Have The Organisational Structure & Communications Changed Over Time?
|
Period |
Description |
Graph |
|
Jul 2015 |
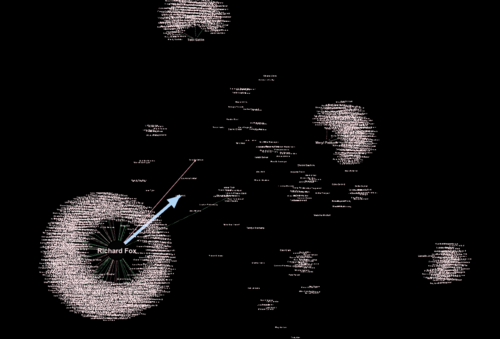
During the initial stage of the organisation in 2015, there isn't much communication and Richard Fox, Tob Gatlin, Maryl Pastuch each communicate within their teams. The first purchase was also made by Richard Fox, a significant role player within the network and organisation. |
|
|
Aug 2015 |
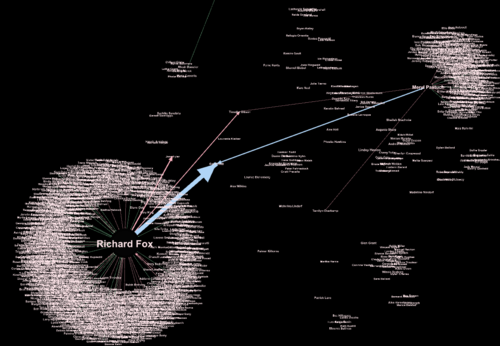
This was the first contact made across teams. Meryl and Richard both purchased from Gail Feindt and Timothy Gibson was probably involved in the "handshake" across teams. |
|
|
Sep 2015 |
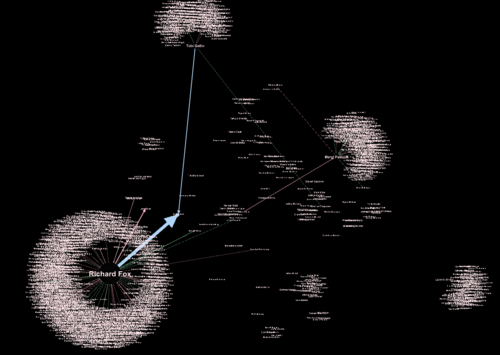
Tobi Gatlin made his first purchased from Gail and since Richard have yet to contact Tobi, Gail being the point of contact could have introduced them. |
|
|
Early Oct 2015 |
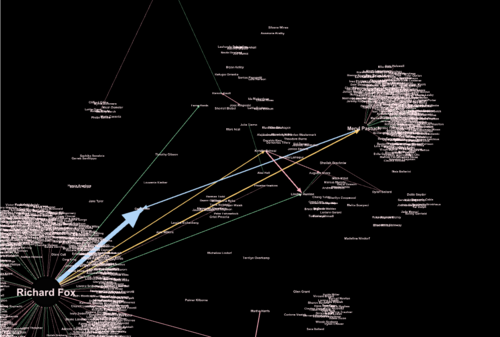
Richard Fox set up a first meeting with Meryl |
|
|
Late Oct 2015 |
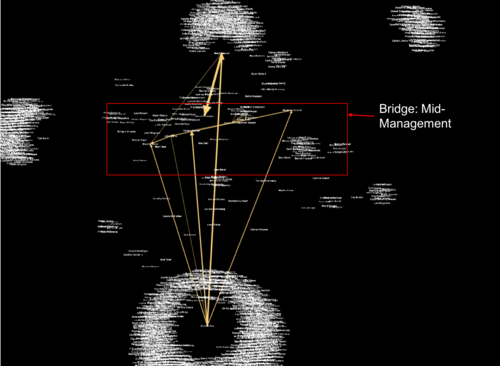
A huge meeting was conducted and surprisingly, these were the only people who were involved in meetings throughout the years. They were probably mid-management and should be investigated since most of the information gets pass down through them. |
|
|
Nov 2015 |
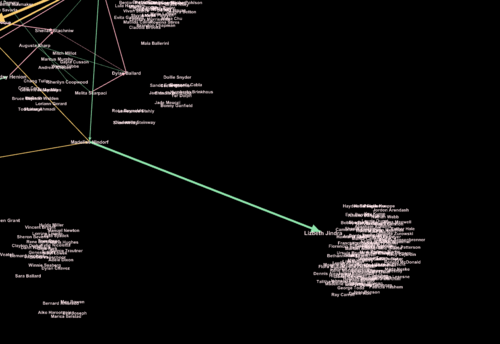
Madeline Nindorf calls Lizbeth Jindra and this was the first encounter where Lizbeth has been brought into the saga. Oddly, Madeline Calls Lizbeth every Oct to Dec for the next few years. Its seems like Madeline is the point of contact with the rest of the suspicious group. |
|
|
Apr 2016 |
After a major meeting between Richard, Kerstin Belveal, and Meryl a purchase was made. |
|
|
End 2016 |
Madeline Nindorf seems to be the point of contact and the bridge between Meryl and Lizbeth since Meryl and Lizbeth do not have any modes of communication thus far. |
|
|
Nov 2016 |
This is Libeth's first purchase from Gail after the many meetings and encounters with the rest of the group through Madeline. Again, Madeline could be seen calling Lizbeth during the end of year period. |
