Difference between revisions of "Observations"
Rupinis.2017 (talk | contribs) |
Rupinis.2017 (talk | contribs) |
||
| (13 intermediate revisions by the same user not shown) | |||
| Line 38: | Line 38: | ||
<font size="3"><font color="#000000">'''1. Inconsistent Data Collection'''</font></font> | <font size="3"><font color="#000000">'''1. Inconsistent Data Collection'''</font></font> | ||
| − | The data is collected from 1998 – 2016 in various locations of the preserve. However, it is noted that readings of many chemical indicators were not collected for the early years. Also, reading from sensors in Achara, Decha, Tansasee were collected only after 2009. There is an inconsistent data collection pattern observed as the number of records in 2006 and 2007 is higher compared to other years. It is found that number of records collected in Boonsri and Chai resulted in 2006 and 2007 contributed to the overall increase in the records. | + | The data is collected from 1998 – 2016 in various locations of the preserve. However, it is noted that readings of many chemical indicators were not collected for the early years. Also, reading from sensors in Achara, Decha, Tansasee were collected only after 2009. There is an inconsistent data collection pattern observed as the number of records in 2006 (August and November) and 2007 (January and March) is higher compared to other years. It is found that number of records collected in Boonsri and Chai resulted in 2006 and 2007 contributed to the overall increase in the records. |
[[Image:RupSample.JPG|480px|Left]] [[Image:Rup location.jpg|480px|Right]] | [[Image:RupSample.JPG|480px|Left]] [[Image:Rup location.jpg|480px|Right]] | ||
| Line 46: | Line 46: | ||
The water temperature and total dissolved O2 shows cyclic pattern over the years. It is also found that they both share a negative relationship; trend shows that increase in water temperature decrease total dissolved O2 value for the given period. The water temperature shows downward trend from October to March whereas total dissolved oxygen shows upward trend during the same time period. April to September is the period when there is increase in water temperature and is seen as an upward trend in the graph. | The water temperature and total dissolved O2 shows cyclic pattern over the years. It is also found that they both share a negative relationship; trend shows that increase in water temperature decrease total dissolved O2 value for the given period. The water temperature shows downward trend from October to March whereas total dissolved oxygen shows upward trend during the same time period. April to September is the period when there is increase in water temperature and is seen as an upward trend in the graph. | ||
| − | + | [[Image:Temp.jpg|700px| width = 200| center]] | |
<font size="3"><font color="#000000">'''3. Sudden drop in total hardness'''</font></font> | <font size="3"><font color="#000000">'''3. Sudden drop in total hardness'''</font></font> | ||
| Line 52: | Line 52: | ||
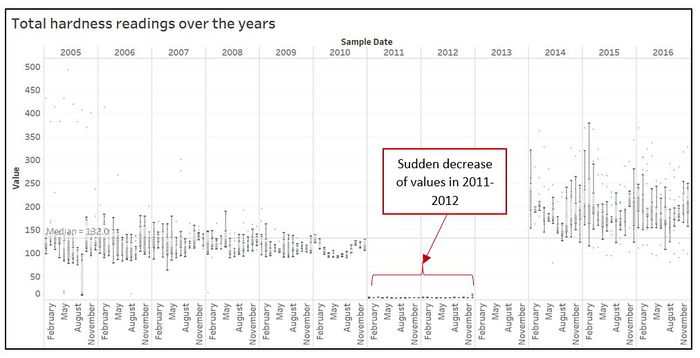
The total hardness reading is collected from 2005. The median value from 2005 to 2016 is 139 mg / l. However, it is found that the hardness value dropped below 5 mg / l in 2011 and this pattern continued in 2012 as well. There is no data collected for the year 2013. There is an increasing trend from year 2014 to 2016 where readings are higher compared to previous 6 years records. | The total hardness reading is collected from 2005. The median value from 2005 to 2016 is 139 mg / l. However, it is found that the hardness value dropped below 5 mg / l in 2011 and this pattern continued in 2012 as well. There is no data collected for the year 2013. There is an increasing trend from year 2014 to 2016 where readings are higher compared to previous 6 years records. | ||
| − | + | [[Image:Total Hardness.jpg|700px|center]] | |
<font size="3"><font color="#000000">'''4. Increase in Anionic Active Surfactant'''</font></font> | <font size="3"><font color="#000000">'''4. Increase in Anionic Active Surfactant'''</font></font> | ||
| Line 59: | Line 59: | ||
[[Image:Rup ano.jpg|550px|Left]] [[Image:Rup map.JPG|400px|Right]] | [[Image:Rup ano.jpg|550px|Left]] [[Image:Rup map.JPG|400px|Right]] | ||
| + | |||
| + | <font size="3"><font color="#000000">'''5. Decrease in Chlorodinine in 2016'''</font></font> | ||
| + | |||
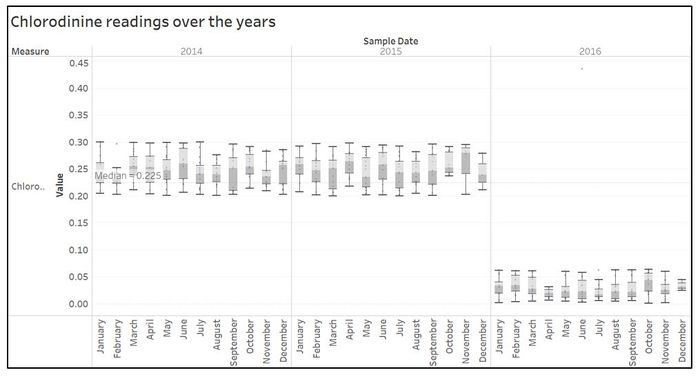
| + | Readings for Chlorodinine is collected by various sensors only for last 3 years (2014 – 2016). Compared to readings in 2014 and 2015, there is clear decreasing trend observed in all readings for 12 months period in 2016. The median reading in 2016 is found to be 0.025 μg / L compared to 0.246 μg / L in 2014 and 0.252 μg / L in 2015. | ||
| + | |||
| + | [[Image:Rup chl.jpg|700px|center]] | ||
| + | |||
| + | ==<font size="5"><font color="#000000">'''Anomalies in the waterway samples'''</font></font>== | ||
| + | |||
| + | Anomalies in the waterway samples dataset is detected by using standard deviation measures. Any value higher or lower than 2 standard deviation is investigated for anomaly across 10 locations of sensors present in Boonsong Lekagul Wildlife Preserve. | ||
| + | |||
| + | |||
| + | <font size="3"><font color="#000000">'''Anomalies in Chemical readings'''</font></font> | ||
| + | |||
| + | <font size="2"><font color="#000000">'''Iron'''</font></font> | ||
| + | |||
| + | In August 2003, the reading for iron showed steep spike in Burasakhan, Chai, Kannika, Kohsoom, Sakda, and Somchair. According to Food and Agriculture Organisation (FAO), the acceptable limit for iron is 3 mg / L in river and other basins. The readings in these 6 locations is found to be above 20,000 mg/L which is 2000 times higher than acceptable limits. | ||
| + | |||
| + | [[Image:Rup iro.jpg|700px|center]] | ||
| + | |||
| + | <font size="2"><font color="#000000">'''Mercury'''</font></font> | ||
| + | |||
| + | In the year 2010 and 2011, the mercury readings in Achara is found to be 1 μg / L and is 10 times higher than acceptable limit. The acceptable limit for mercury in water bodies such as river is 0.5 μg / L as indicated by Food and Agriculture Organisation. Mercury is known to be a potent neurotoxin for fish, wildlife and humans. The increase in mercury levels is to be viewed as serious problem as it can affect the whole ecosystem prevailing within the preserve. | ||
| + | |||
| + | [[Image:Rup mer.jpg|700px|center]] | ||
| + | |||
| + | <font size="2"><font color="#000000">'''Chlorodinine'''</font></font> | ||
| + | |||
| + | It is observed from overall trend that there is decrease in readings for Chlorodinine across sensor locations within the preserve in 2016. However, it can be inferred from below graph that there is an increase in reading in June 2016 at Kohsoom. As there is only one abnormal reading observed across location in that month, it could be due to some problem in sensor functioning on the particular day. | ||
| + | |||
| + | [[Image:Rup abn.jpg|700px|center]] | ||
| + | |||
| + | <font size="3"><font color="#000000">'''Anomalies in Biological readings'''</font></font> | ||
| + | |||
| + | <font size="2"><font color="#000000">'''Fecal Coliform, Fecal Streptococci, Macrozoobenthos'''</font></font> | ||
| + | |||
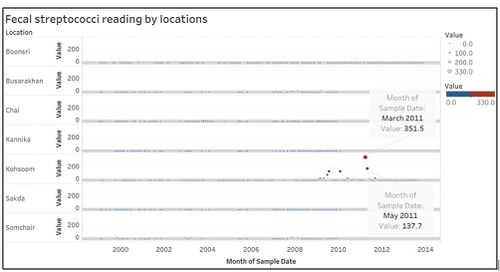
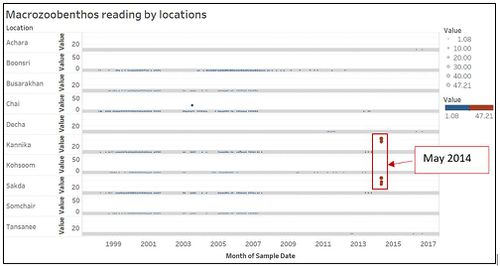
| + | The reading of Fecal coliform and Streptococci is observed to have increased at Kohsoom in 2011. There is also spike in fecal coliform reading in June 2010 in Kohsoom. Fecal coliform increased by 100 times and fecal streptococci by 270 times from their respective average reading in 2011. Macrozoobenthos reading is found to be 45 times higher than average value in Kannika and Sakda in May 2014.The increase in biological reading is indicative of poor water quality and could be due to excessive dumping of biological materials around Kohsoom area in 2011. | ||
| + | |||
| + | [[Image:Rup col.jpg|500px|center]] | ||
| + | |||
| + | [[Image:Rup stre.jpg|500px|center]] | ||
| + | |||
| + | [[Image:Rup mac.JPG|500px|center]] | ||
| + | |||
| + | ==<font size="5"><font color="#000000">'''Area of concern and ways to improve'''</font></font>== | ||
| + | |||
| + | <font size="3"><font color="#000000">'''Toxic contaminant - Methylosmolene'''</font></font> | ||
| + | |||
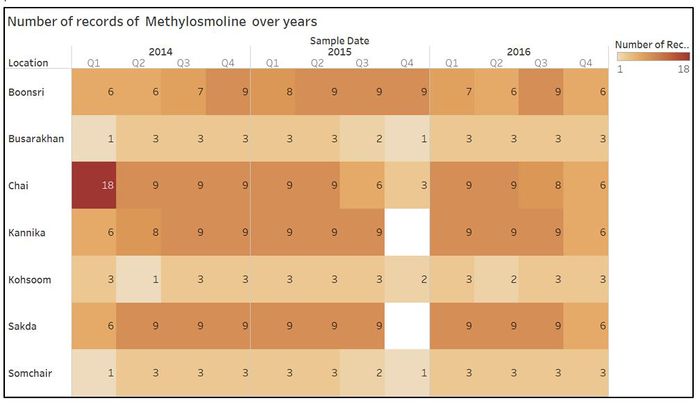
| + | Methylosmolene is found to be key contaminant that affects the water bodies across the preserve. However, it is noted that readings for methylosmolene collected by sensors is available only last 3 years (2014 – 2016). In addition, Kannika and Sakda did not collect any data from sensors during quarter 4 of 2015. Some locations have only 1 or 2 readings per quarter making it difficult to assess the exact situation within preserve. | ||
| + | |||
| + | [[Image:Rup rec.JPG|700px|center]] | ||
| + | |||
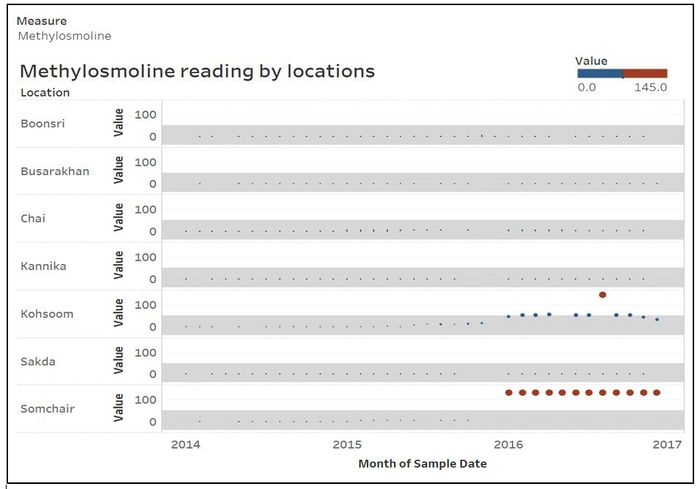
| + | There is a clear increasing trend observed in 2016 compared to previous two years. The reading in Somchair from January 2016 to December remained high as 130.5 μg / L compared to 4.5 μg / L in October 2015 reading at Somchair. In Kohsoom, the average reading in 2016 is around 45 μg / L compared to overall average of 5.4 μg / L. This is clearly shows that Methylosmolinine is dumped heavily into water bodies by industries around Kohsoom and Somchair in 2016. Also, Kohsoom is identified as one of key location for industrial waste dumping. As a known toxic contaminant, the high content of Methylosmolinine in water can adversely affect the marine wildlife such as fish. This in turn can affect birds especially Blue pipit which might feed on fish that consumed this pollutant. Apart from birds consuming the fishes from polluted water, birds can also be affected by other skin problems when they come in direct contact with polluted water. | ||
| + | |||
| + | [[Image:Rup met.JPG|700px|center]] | ||
| + | |||
| + | <font size="3"><font color="#000000">'''Data collection over years'''</font></font> | ||
| + | |||
| + | The Mistford College Hydrology Department has been collecting water quality chemical indicator readings sporadically over the years. Also, there are many missing records across different location in the preserve. It is therefore difficult to assess the comprehensive situation across the preserve and how wildlife is affected by change in water quality. For example, heavy metals such as Arsenic, Manganese, Mercury, Cadmium etc., are known cause adverse effects to wildlife in general. It is found from the below graph that the readings for these chemicals were not collected in the regular basis. | ||
| + | |||
| + | [[Image:Rup fin.jpg|700px|center]] | ||
| + | |||
| + | <font size="3"><font color="#000000">'''Recommendations to hydrology department'''</font></font> | ||
| + | |||
| + | * Readings for all chemical indicators of water quality needs to be captured at regular intervals such as weekly or fortnightly to understand how these chemicals affect the water bodies within preserve. | ||
| + | |||
| + | * Along with water quality indicators readings, air quality monitor readings can be used. As we know, air pollutants such as sulphur dioxide and nitrogen oxide can combine with moisture and result in acid rain. This result in acid rain which can also affect plants and wildlife in general. Therefore, collecting air quality reading can provide better understanding of water quality from different aspects. | ||
| + | |||
| + | * The water contaminants are likely to be washed downstream over the period of time. This can also result in low readings of chemical because of dilution. Therefore, more locations needs to be identified across the river basin and sensors to be installed in those locations to pinpoint the exact location of contaminants. | ||
Latest revision as of 00:11, 9 July 2018
|
|
|
|
|
|
|
Chemical Trend Analysis
1. Inconsistent Data Collection
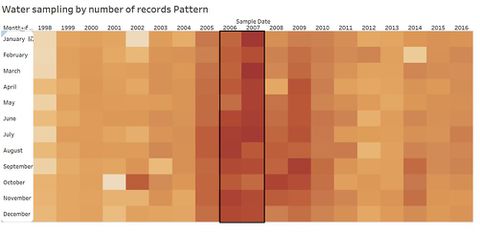
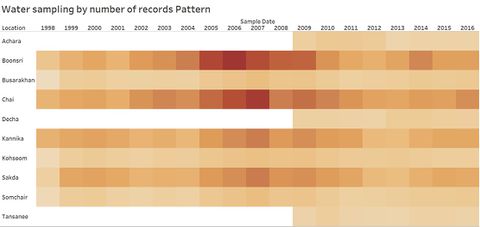
The data is collected from 1998 – 2016 in various locations of the preserve. However, it is noted that readings of many chemical indicators were not collected for the early years. Also, reading from sensors in Achara, Decha, Tansasee were collected only after 2009. There is an inconsistent data collection pattern observed as the number of records in 2006 (August and November) and 2007 (January and March) is higher compared to other years. It is found that number of records collected in Boonsri and Chai resulted in 2006 and 2007 contributed to the overall increase in the records.
2. Cyclic Pattern
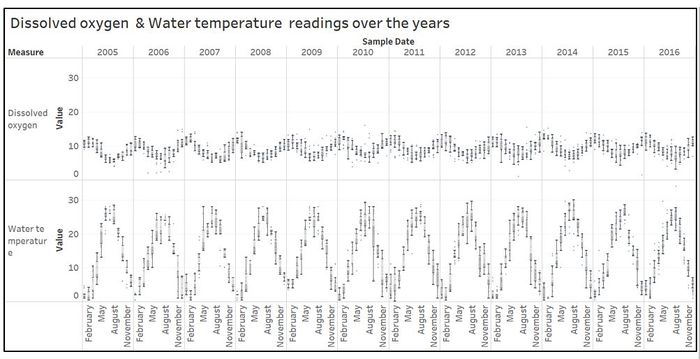
The water temperature and total dissolved O2 shows cyclic pattern over the years. It is also found that they both share a negative relationship; trend shows that increase in water temperature decrease total dissolved O2 value for the given period. The water temperature shows downward trend from October to March whereas total dissolved oxygen shows upward trend during the same time period. April to September is the period when there is increase in water temperature and is seen as an upward trend in the graph.
3. Sudden drop in total hardness
The total hardness reading is collected from 2005. The median value from 2005 to 2016 is 139 mg / l. However, it is found that the hardness value dropped below 5 mg / l in 2011 and this pattern continued in 2012 as well. There is no data collected for the year 2013. There is an increasing trend from year 2014 to 2016 where readings are higher compared to previous 6 years records.
4. Increase in Anionic Active Surfactant
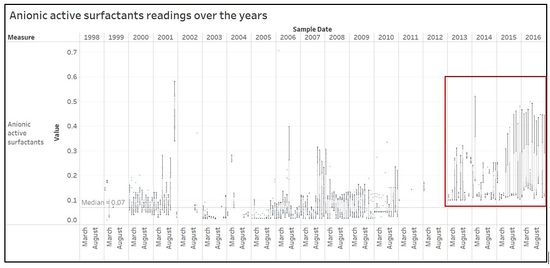
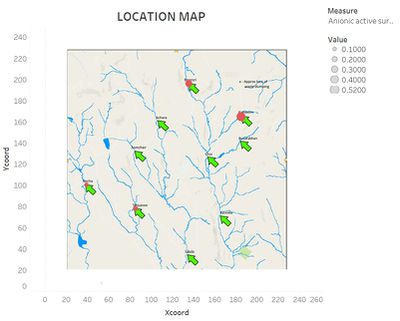
Anionic active surfactant is generally used in cleaning products. The readings of anionic active surfactant are collected from 1999 from various sensors in the preserve. The number of reading collected for this chemical indicator is found to be very low in 1999, 2002, 2011, and 2012 compared to other sampling years. It is found that the value of anionic active surfactant has increased from the year 2013 to 2016. Boonsri and Kohsoom are found to have higher values of Anionic active surfactant from 2013 until 2016. As shown in the map, Kohsoom is identified as one location for waste dumping in the previous studies.
5. Decrease in Chlorodinine in 2016
Readings for Chlorodinine is collected by various sensors only for last 3 years (2014 – 2016). Compared to readings in 2014 and 2015, there is clear decreasing trend observed in all readings for 12 months period in 2016. The median reading in 2016 is found to be 0.025 μg / L compared to 0.246 μg / L in 2014 and 0.252 μg / L in 2015.
Anomalies in the waterway samples
Anomalies in the waterway samples dataset is detected by using standard deviation measures. Any value higher or lower than 2 standard deviation is investigated for anomaly across 10 locations of sensors present in Boonsong Lekagul Wildlife Preserve.
Anomalies in Chemical readings
Iron
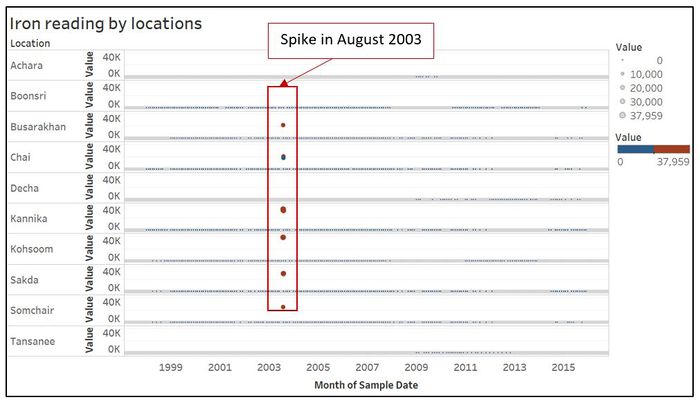
In August 2003, the reading for iron showed steep spike in Burasakhan, Chai, Kannika, Kohsoom, Sakda, and Somchair. According to Food and Agriculture Organisation (FAO), the acceptable limit for iron is 3 mg / L in river and other basins. The readings in these 6 locations is found to be above 20,000 mg/L which is 2000 times higher than acceptable limits.
Mercury
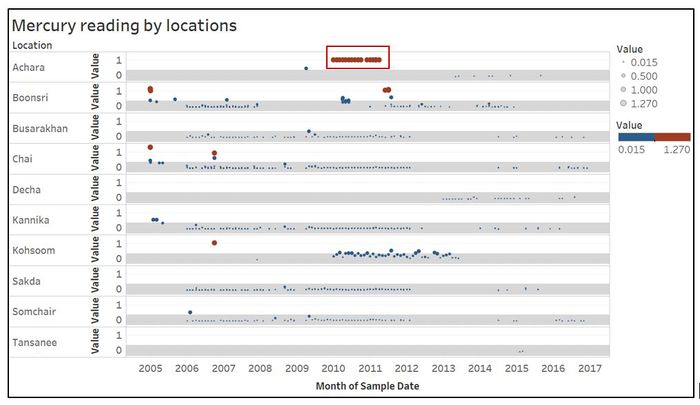
In the year 2010 and 2011, the mercury readings in Achara is found to be 1 μg / L and is 10 times higher than acceptable limit. The acceptable limit for mercury in water bodies such as river is 0.5 μg / L as indicated by Food and Agriculture Organisation. Mercury is known to be a potent neurotoxin for fish, wildlife and humans. The increase in mercury levels is to be viewed as serious problem as it can affect the whole ecosystem prevailing within the preserve.
Chlorodinine
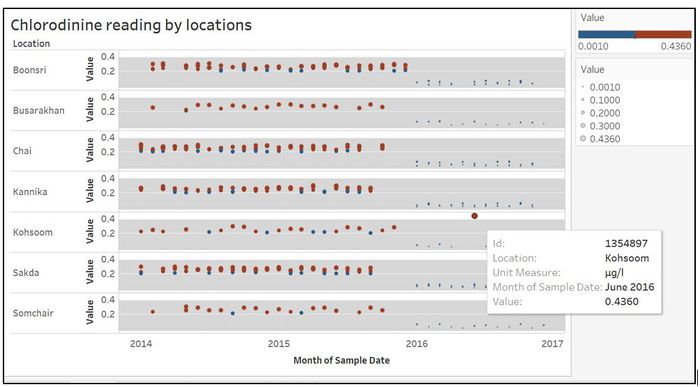
It is observed from overall trend that there is decrease in readings for Chlorodinine across sensor locations within the preserve in 2016. However, it can be inferred from below graph that there is an increase in reading in June 2016 at Kohsoom. As there is only one abnormal reading observed across location in that month, it could be due to some problem in sensor functioning on the particular day.
Anomalies in Biological readings
Fecal Coliform, Fecal Streptococci, Macrozoobenthos
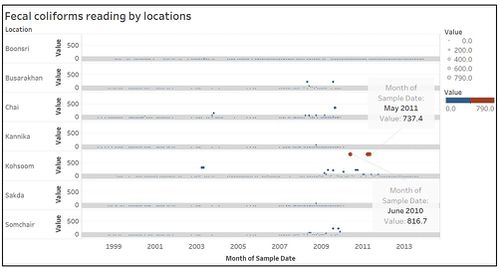
The reading of Fecal coliform and Streptococci is observed to have increased at Kohsoom in 2011. There is also spike in fecal coliform reading in June 2010 in Kohsoom. Fecal coliform increased by 100 times and fecal streptococci by 270 times from their respective average reading in 2011. Macrozoobenthos reading is found to be 45 times higher than average value in Kannika and Sakda in May 2014.The increase in biological reading is indicative of poor water quality and could be due to excessive dumping of biological materials around Kohsoom area in 2011.
Area of concern and ways to improve
Toxic contaminant - Methylosmolene
Methylosmolene is found to be key contaminant that affects the water bodies across the preserve. However, it is noted that readings for methylosmolene collected by sensors is available only last 3 years (2014 – 2016). In addition, Kannika and Sakda did not collect any data from sensors during quarter 4 of 2015. Some locations have only 1 or 2 readings per quarter making it difficult to assess the exact situation within preserve.
There is a clear increasing trend observed in 2016 compared to previous two years. The reading in Somchair from January 2016 to December remained high as 130.5 μg / L compared to 4.5 μg / L in October 2015 reading at Somchair. In Kohsoom, the average reading in 2016 is around 45 μg / L compared to overall average of 5.4 μg / L. This is clearly shows that Methylosmolinine is dumped heavily into water bodies by industries around Kohsoom and Somchair in 2016. Also, Kohsoom is identified as one of key location for industrial waste dumping. As a known toxic contaminant, the high content of Methylosmolinine in water can adversely affect the marine wildlife such as fish. This in turn can affect birds especially Blue pipit which might feed on fish that consumed this pollutant. Apart from birds consuming the fishes from polluted water, birds can also be affected by other skin problems when they come in direct contact with polluted water.
Data collection over years
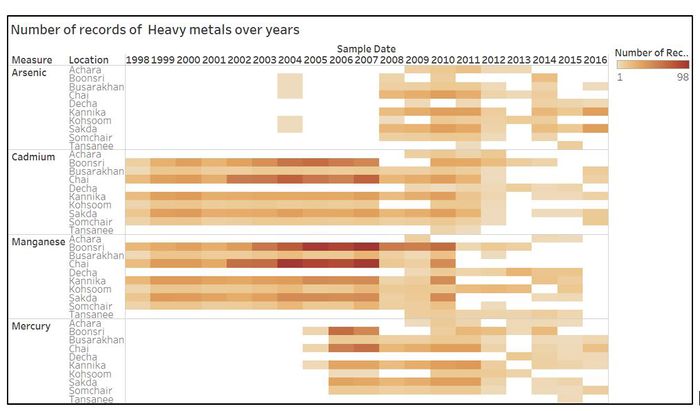
The Mistford College Hydrology Department has been collecting water quality chemical indicator readings sporadically over the years. Also, there are many missing records across different location in the preserve. It is therefore difficult to assess the comprehensive situation across the preserve and how wildlife is affected by change in water quality. For example, heavy metals such as Arsenic, Manganese, Mercury, Cadmium etc., are known cause adverse effects to wildlife in general. It is found from the below graph that the readings for these chemicals were not collected in the regular basis.
Recommendations to hydrology department
- Readings for all chemical indicators of water quality needs to be captured at regular intervals such as weekly or fortnightly to understand how these chemicals affect the water bodies within preserve.
- Along with water quality indicators readings, air quality monitor readings can be used. As we know, air pollutants such as sulphur dioxide and nitrogen oxide can combine with moisture and result in acid rain. This result in acid rain which can also affect plants and wildlife in general. Therefore, collecting air quality reading can provide better understanding of water quality from different aspects.
- The water contaminants are likely to be washed downstream over the period of time. This can also result in low readings of chemical because of dilution. Therefore, more locations needs to be identified across the river basin and sensors to be installed in those locations to pinpoint the exact location of contaminants.
