Difference between revisions of "ISSS608 2017-18 T3 Assign Vigneshwar Ramachandran Vadivel Findings"
| (4 intermediate revisions by the same user not shown) | |||
| Line 38: | Line 38: | ||
<!------- End of Secondary Navigation Bar----> | <!------- End of Secondary Navigation Bar----> | ||
<br> | <br> | ||
| − | <div > | + | <div> |
Using the four large Kasios International data sets, combine the different sources to create a single picture of the company. Characterize changes in the company over time. According to the company’s communications and purchase habits, is the company growing? </div> | Using the four large Kasios International data sets, combine the different sources to create a single picture of the company. Characterize changes in the company over time. According to the company’s communications and purchase habits, is the company growing? </div> | ||
| Line 66: | Line 66: | ||
Another perspective to approach this problem would be considering the number of employee involved in the communication network over the years, since number of employees over years is an indication of organization growth. | Another perspective to approach this problem would be considering the number of employee involved in the communication network over the years, since number of employees over years is an indication of organization growth. | ||
| − | [[File:A1_MC3_Q1_Employee.png|centre|frameless|link=ISSS608_2017-18_T3_Assign_Vigneshwar Ramachandran Vadivel | + | [[File:A1_MC3_Q1_Employee.png|centre|frameless|700px|link=ISSS608_2017-18_T3_Assign_Vigneshwar Ramachandran Vadivel |
]] | ]] | ||
| − | [[File:A1_MC3_Q1_Employee1.png|centre|frameless|link=ISSS608_2017-18_T3_Assign_Vigneshwar Ramachandran Vadivel | + | [[File:A1_MC3_Q1_Employee1.png|centre|frameless|700px|link=ISSS608_2017-18_T3_Assign_Vigneshwar Ramachandran Vadivel |
]] | ]] | ||
This graph shows us the number of employee involved in the communication over years to understand the organization growth. It shows us the number of employee involved in meetings has been evolved gradually over years, whereas other transactions show relatively same trend in number of employees involved. | This graph shows us the number of employee involved in the communication over years to understand the organization growth. It shows us the number of employee involved in meetings has been evolved gradually over years, whereas other transactions show relatively same trend in number of employees involved. | ||
| − | [[File:A1_MC3_Q1_Purchase.png|centre|frameless|link=ISSS608_2017-18_T3_Assign_Vigneshwar Ramachandran Vadivel | + | [[File:A1_MC3_Q1_Purchase.png|centre|700px|frameless|link=ISSS608_2017-18_T3_Assign_Vigneshwar Ramachandran Vadivel |
]] | ]] | ||
Finally, the purchase pattern of the organization over years will be a clear indicator of its growth. | Finally, the purchase pattern of the organization over years will be a clear indicator of its growth. | ||
Latest revision as of 12:31, 8 July 2018

To understand the Kasios communication data, let’s look at the total transaction happened during last three years,
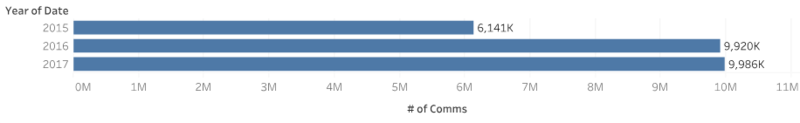
This clearly shows that the there is a significant increase in communication transaction happened over 2016 compared to 2015.However, 2017 remains close to the transaction happened in 2016, shows a saturated trend in communication data.
As given, there are four modes of transactions happened in the organization. It is important to drilldown to the type of transaction to analyse the trend,
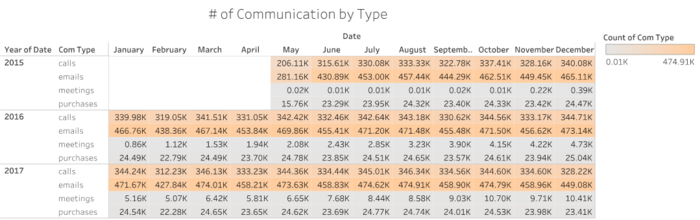
Email is the primary mode of communication among the employees over years followed by Calls. Meetings has been tremendously increased over years which clearly shows the growth of organization. Purchases follow the similar trend as the other transaction types.
Another level of drilldown the communications to weeks and days will give us more information on the communication pattern. Hence, I created a heatmap to visualise the transactions over days and weeks. The heatmap below is on a range of intensity of green to red, the red shade representing the most number of communication data.
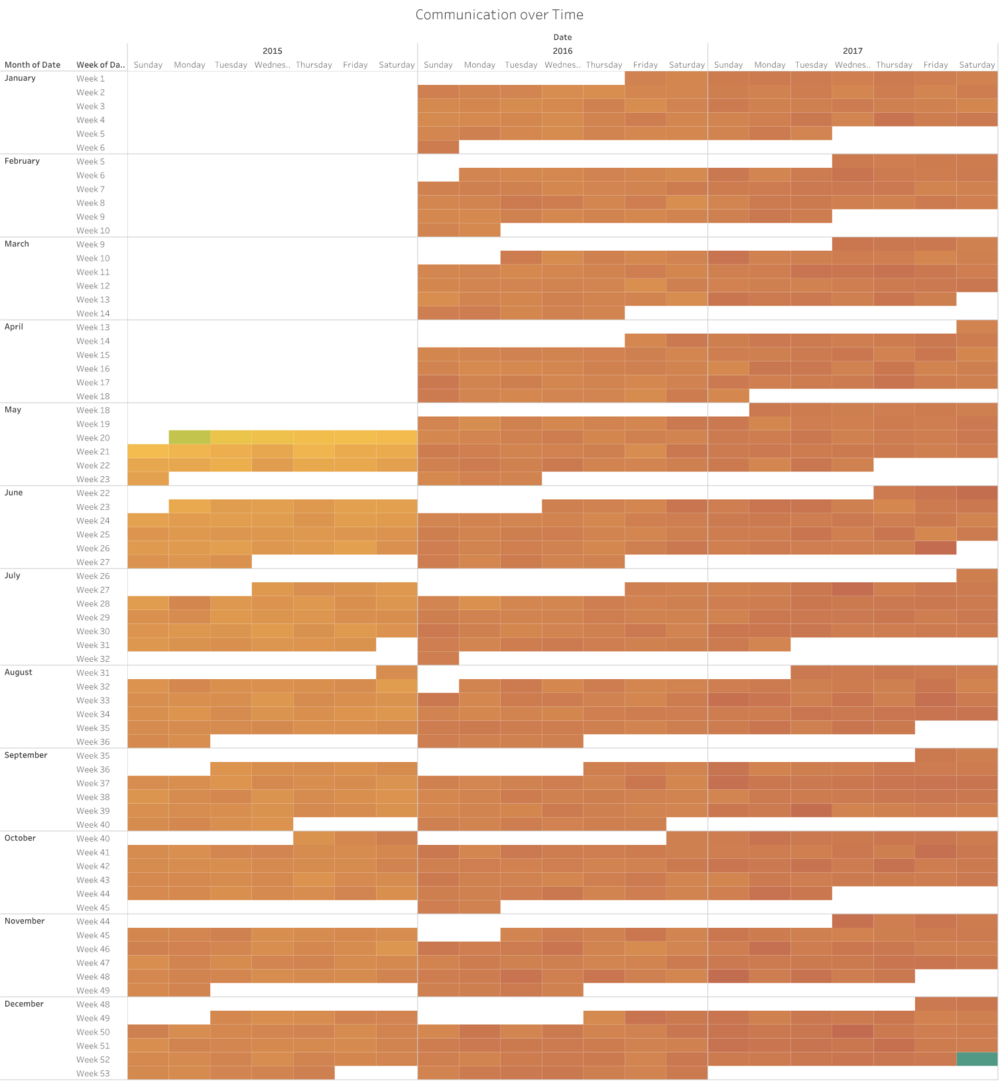
The heatmap shows us the gradual increase in number of transactions over years. 2015 shows irregular trend in communication pattern with relatively low number of transactions. 2016 and 2017 shows a clear increasing trend with later part of 2017 remains significantly higher than other years. This shows the increase in Kasios communication, which could be an indicator of growth of the organization.
Another perspective to approach this problem would be considering the number of employee involved in the communication network over the years, since number of employees over years is an indication of organization growth.
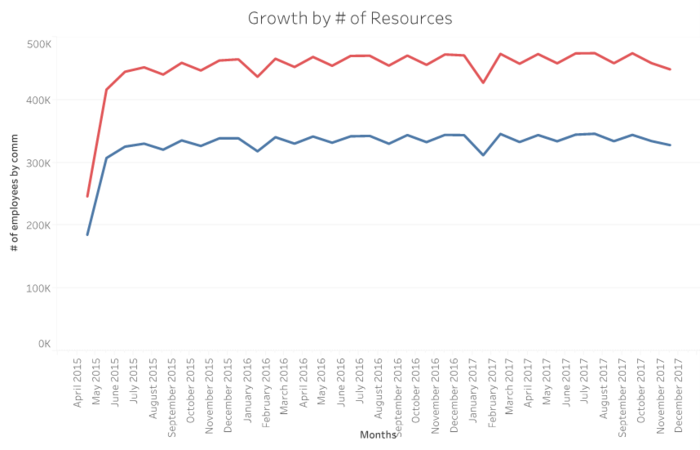
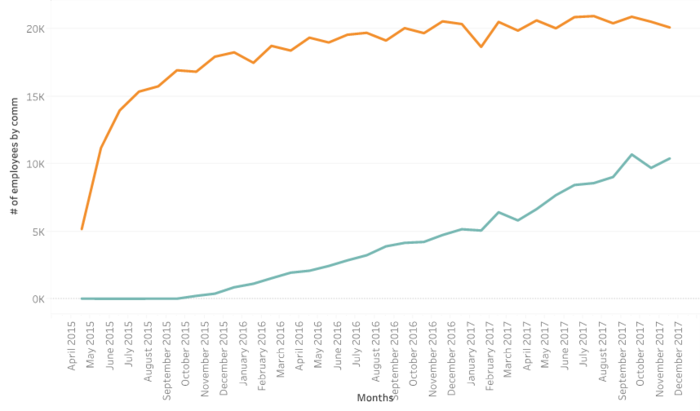
This graph shows us the number of employee involved in the communication over years to understand the organization growth. It shows us the number of employee involved in meetings has been evolved gradually over years, whereas other transactions show relatively same trend in number of employees involved.
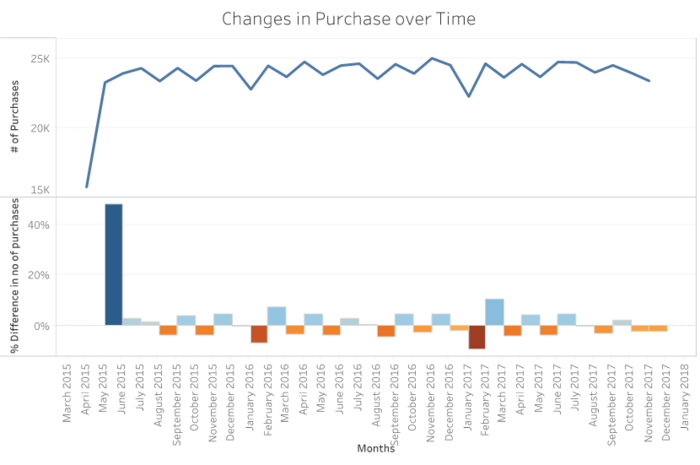
Finally, the purchase pattern of the organization over years will be a clear indicator of its growth. When we look at the purchase pattern there is a steep increase in 2015 and the trend remains closer to the range of 20K -25K on the remaining months. The % difference in the purchase pattern shows that the trend remains uniform other than the sporadic increase in 2015.
Summary: All the communication trend and number of employees involved in the transaction, clearly shows that the organization has been growing over years. Purchasing pattern is noticeable over ye