Difference between revisions of "ISSS608 2017-18 T3 Assign Yi Xiaoqin Data Preparation"
| Line 5: | Line 5: | ||
<!--MAIN HEADER --> | <!--MAIN HEADER --> | ||
{|style="background-color:#d4efdf;" width="100%" cellspacing="0" cellpadding="0" valign="top" border="0" | | {|style="background-color:#d4efdf;" width="100%" cellspacing="0" cellpadding="0" valign="top" border="0" | | ||
| − | | style="font-family:Century Gothic; font-size:100%; solid #000000; background:#d4efdf; text-align:center;" width=" | + | | style="font-family:Century Gothic; font-size:100%; solid #000000; background:#d4efdf; text-align:center;" width="20%" | |
; | ; | ||
[[ISSS608 2017-18 T3 Assign Yi Xiaoqin|<b><font size="4"><font color="#2c3e50 ">Background</font></font></b>]] | [[ISSS608 2017-18 T3 Assign Yi Xiaoqin|<b><font size="4"><font color="#2c3e50 ">Background</font></font></b>]] | ||
| − | | style="font-family:Century Gothic; font-size:100%; solid #1B338F; background:#fad7a0; text-align:center;" width=" | + | | style="font-family:Century Gothic; font-size:100%; solid #1B338F; background:#fad7a0; text-align:center;" width="20%" | |
; | ; | ||
[[ISSS608 2017-18 T3 Assign Yi Xiaoqin_Data_Preparation|<b><font size="3"><font color="#2c3e50 ">Data Preparation</font></font></b>]] | [[ISSS608 2017-18 T3 Assign Yi Xiaoqin_Data_Preparation|<b><font size="3"><font color="#2c3e50 ">Data Preparation</font></font></b>]] | ||
| − | | style="font-family:Century Gothic; font-size:100%; solid #1B338F; background:#d4efdf; text-align:center;" width=" | + | | style="font-family:Century Gothic; font-size:100%; solid #1B338F; background:#d4efdf; text-align:center;" width="20%" | |
; | ; | ||
[[ISSS608 2017-18 T3 Assign Yi Xiaoqin_Visualization|<b><font size="3"><font color="#2c3e50 ">Methodology&Visualization</font></font></b>]] | [[ISSS608 2017-18 T3 Assign Yi Xiaoqin_Visualization|<b><font size="3"><font color="#2c3e50 ">Methodology&Visualization</font></font></b>]] | ||
| − | | style="font-family:Century Gothic; font-size:100%; solid #1B338F; background:#d4efdf; text-align:center;" width=" | + | | style="font-family:Century Gothic; font-size:100%; solid #1B338F; background:#d4efdf; text-align:center;" width="20%" | |
; | ; | ||
| − | [[ISSS608 2017-18 T3 Assign Yi Xiaoqin_Conclusion| <b><font size="3"><font color="#2c3e50 "> | + | [[ISSS608 2017-18 T3 Assign Yi Xiaoqin_Insights| <b><font size="3"><font color="#2c3e50 ">Insights</font></font></b>]] |
| + | |||
| + | | style="font-family:Century Gothic; font-size:100%; solid #1B338F; background:#d4efdf; text-align:center;" width="20%" | | ||
| + | ; | ||
| + | [[ISSS608 2017-18 T3 Assign Yi Xiaoqin_Conclusion| <b><font size="3"><font color="#2c3e50 ">MC2 Answer&Comment</font></font></b>]] | ||
| | | | ||
Latest revision as of 22:26, 4 July 2018
|
|
|
|
|
|
Contents
Variable Detection & Transformation
- In chemical units of measure.csv file, field unit has one missing value for measure Macrozoobethos, a terminology of one animal species, which could be reasonable without unit in the case.
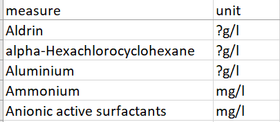
- Some chemical units have question mark rather than letter m, replace them with “mg/l” in Excel.
Data Consolidation
Merge Given Fields
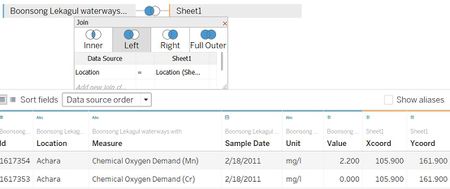
Consolidate waterways readings data with chemical units in Tableau by left join.
Add New Variables
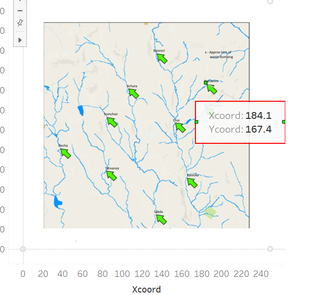
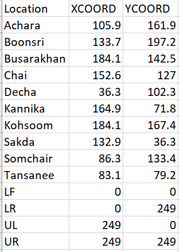
Given a waterways final picture, we can find approximate X-coordinate and Y-coordinate for each location of the preserve to generate geographical visualizations, which may contribute to the analytics findings.
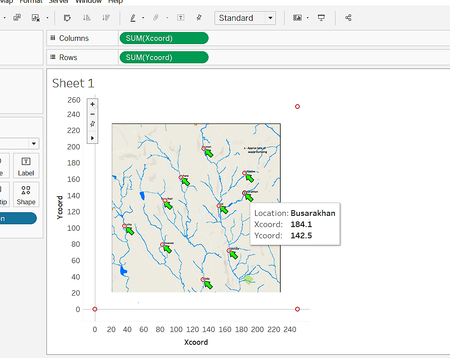
- Create a new excel file including all 10 locations as a data source in Tableau and add the Waterways image as background to get picture reference.
- Add annotate point onto the image and move cursor to each location to get their X-axis and Y-axis values. Then fill in the new Location excel.
- Repeat same process to check whether the coordinate value fit the given waterways map.
Merge New Variables
Use Tableau to join previous dataset with location data to get the full data for subsequent analysis. Noted that the waterways map is not the real geographical site in real world, thus, the generated fake map will help to identify the abnormal or special locations.
Data Exploration
Before applying methods for visual analytics, we should do some exploratory analysis for basic understanding of the data.
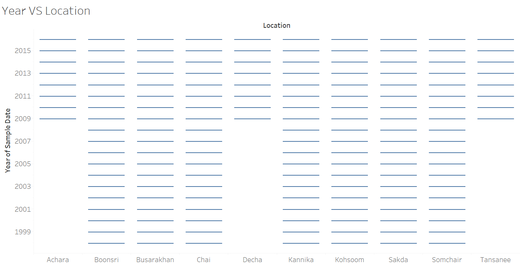
Year VS Location: The date scope of sampling data is from 1998 to 2016 inclusive of all the quarters. Among the 10 locations of preserve area, Acara, Decha and Tansanee do not have the hydrology data records from 1998 to 2008.
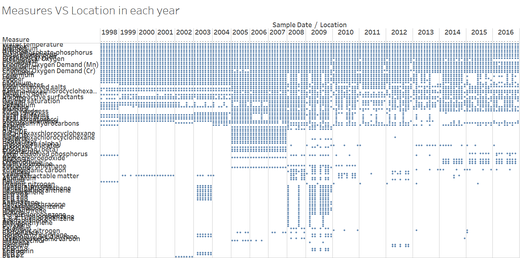
Measures VS Location in each year: Over the 19 years, not all the 106 measures have been taken or recorded for each location at Year level. For example, water temperature, Nitrites and Ammonium are top measures having most data observations in this case.
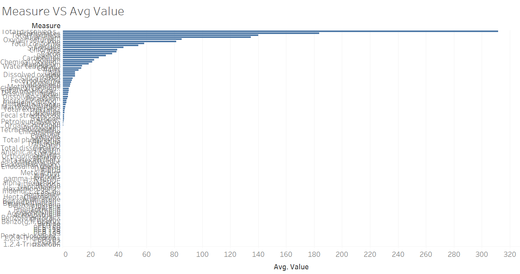
Measure VS Avg Value: Apart from water temperature has unit C (centigrade) and macrozoobenthos does not have a unit here, all the chemical measures’ units are mg/l, from the bar chart, we know that average value of measures has a range gap of over 300 mg/l.
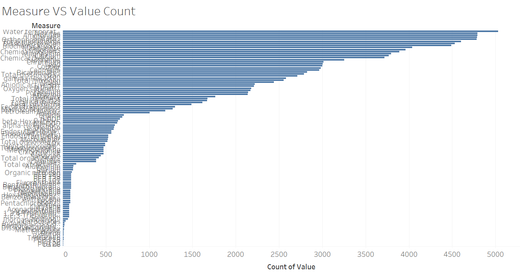
Measure VS Value Count: For each measure, we count it to get the total number of the recorded; the range is also large, which is related to Measures VS Location chart in a way: there is a change that the more location taking records of that measure, the bigger count that measure has.

