Difference between revisions of "ISSS608 2016-17 T3 Assign APARAJITA SHUKLA DataPrep"
(Methodoogy changes) |
(dataprep) |
||
| (3 intermediate revisions by the same user not shown) | |||
| Line 1: | Line 1: | ||
| + | <div> | ||
| + | [[Image:Factory-and-water-pollution-illustration.jpg|300px]] | ||
| + | <font size = 5; font color="#21618C"> VAST Challenge: Mini Challenge 2</font> | ||
| + | </div> | ||
| + | |||
| + | |||
| + | <div style=background:#438787 | ||
| + | |||
| + | <gallery> | ||
| + | File:Factory-and-water-pollution-illustration.jpg|Caption1 | ||
| + | File:image_1.png|Caption2 | ||
| + | </gallery> | ||
| + | [[Image:image_1.png|thumbnail]] | ||
| + | [[File:Factory-and-water-pollution-illustration.jpg|200px|thumb|left|alt text]] | ||
| + | border:#A3BFB1> | ||
| + | <i> <font size = 0.5; color=#438787> VAST MINI CHALLENGE 2: </font> </i> | ||
| + | |||
| + | <font size = 5; color="#FFFFFF">Like a Duck to Water</font> | ||
| + | </div> | ||
| + | <!--MAIN HEADER --> | ||
| + | {|style="background-color:#438787;" width="100%" cellspacing="0" cellpadding="0" valign="top" border="0" | | ||
| + | | style="font-family:Century Gothic; font-size:100%; solid #1B338F; background:#0b3d53; text-align:center;" width="25%" | | ||
| + | ; | ||
| + | [[ISSS608_2016-17_T3_Assign_APARAJITA SHUKLA_Overview| <font color="#FFFFFF">Introduction</font>]] | ||
| + | |||
| + | | style="font-family:Century Gothic; font-size:100%; solid #1B338F; background:#0b3d53; text-align:center;" width="25%" | | ||
| + | ; | ||
| + | [[ISSS608_2016-17_T3_Assign_APARAJITA SHUKLA_DataPrep| <font color="#FFFFFF">Data Preparation & Methodology</font>]] | ||
| + | |||
| + | | style="font-family:Century Gothic; font-size:100%; solid #1B338F; background:#0b3d53; text-align:center;" width="25%" | | ||
| + | ; | ||
| + | [[ISSS608_2016-17_T3_Assign_APARAJITA SHUKLA_Visualizations| <font color="#FFFFFF">Insight & Conclusion</font>]] | ||
| + | |||
| + | ; | ||
| + | | style="font-family:Century Gothic; font-size:100%; solid #1B338F; background:#0b3d53; text-align:center;" width="25%" | | ||
| + | |||
| + | [[Assignment_Dropbox_G2| <font color="#FFFFFF">Back to Dropbox</font>]] | ||
| + | | | ||
| + | |} | ||
| + | |||
<!--MAIN HEADER--> | <!--MAIN HEADER--> | ||
| Line 8: | Line 48: | ||
Where two files are .csv and one is .txt. | Where two files are .csv and one is .txt. | ||
| + | [[Image:dp1.png|700px]] | ||
| − | The first file, Boonsong Lekagul waterways readings.csv contains 5 columns namely Id, value, location, sample date, measure and have 136924 rows. | + | * The first file, Boonsong Lekagul waterways readings.csv contains 5 columns namely '''''Id, value, location, sample date, measure''''' and have 136924 rows. |
| − | The second file, chemical units of measure.csv has two columns namely, measure | + | * The second file, chemical units of measure.csv has two columns namely, '''''measure and unit'''''. |
| − | The third .txt file basically contains all the information about the data present in the other files. | + | * The third .txt file basically contains all the information about the data present in the other files. |
| + | |||
| + | * The last .jpg file contains the map of Boonsong Lekagul waterways. | ||
| + | |||
| − | |||
<div style=background:#438787 border:#A3BFB1> | <div style=background:#438787 border:#A3BFB1> | ||
| Line 23: | Line 66: | ||
To check the missing values, I have used JMP. | To check the missing values, I have used JMP. | ||
| + | |||
| + | [[Image:picture2_apa.png|700px]] | ||
As can be seen from the image above, there were no missing value present in given dataset. | As can be seen from the image above, there were no missing value present in given dataset. | ||
| + | |||
<div style=background:#438787 border:#A3BFB1> | <div style=background:#438787 border:#A3BFB1> | ||
<font size = 3; color="#FFFFFF">Getting the Map</font> | <font size = 3; color="#FFFFFF">Getting the Map</font> | ||
</div> | </div> | ||
| + | |||
After importing data file into tableau, we first import the image of the map and using annotate using points, I marked all the locations in the map and manually created a separate .xslx file: | After importing data file into tableau, we first import the image of the map and using annotate using points, I marked all the locations in the map and manually created a separate .xslx file: | ||
| − | + | [[Image:picture3_apa.png|700px]] | |
| Line 45: | Line 92: | ||
As we needed to join Location table, measure.csv and Boonsong Lekagul waterways readings.csv tables together, the tool used for this is Tableau: | As we needed to join Location table, measure.csv and Boonsong Lekagul waterways readings.csv tables together, the tool used for this is Tableau: | ||
| − | + | [[Image:picture4_apa.png|700px]] | |
| − | |||
| − | |||
| − | |||
Latest revision as of 20:35, 7 July 2018
VAST MINI CHALLENGE 2:
Like a Duck to Water
|
|
|
|
Methodology
We have been provided with three files along with a map of the Boonsong Lekagul preserve area. Where two files are .csv and one is .txt.
- The first file, Boonsong Lekagul waterways readings.csv contains 5 columns namely Id, value, location, sample date, measure and have 136924 rows.
- The second file, chemical units of measure.csv has two columns namely, measure and unit.
- The third .txt file basically contains all the information about the data present in the other files.
- The last .jpg file contains the map of Boonsong Lekagul waterways.
Checking Missing Values
To check the missing values, I have used JMP.
As can be seen from the image above, there were no missing value present in given dataset.
Getting the Map
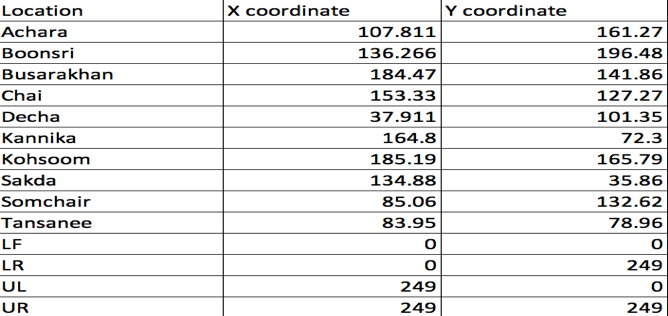
After importing data file into tableau, we first import the image of the map and using annotate using points, I marked all the locations in the map and manually created a separate .xslx file:
And then create map by dragging and dropping the coordinates on the worksheet.
Joining the Tables
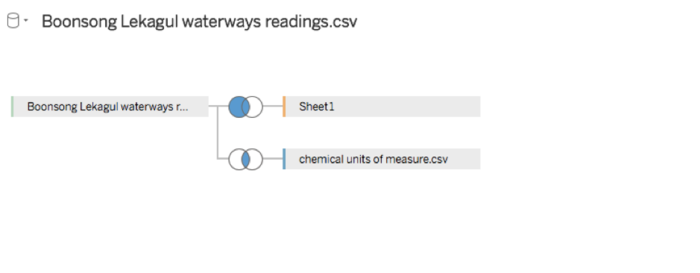
As we needed to join Location table, measure.csv and Boonsong Lekagul waterways readings.csv tables together, the tool used for this is Tableau:


