Difference between revisions of "Group25 Proposal"
(v113) |
|||
| (12 intermediate revisions by 2 users not shown) | |||
| Line 9: | Line 9: | ||
</div> | </div> | ||
| − | + | {|style= background-color:"#003366"; width="100%" cellspacing="0" cellpadding="0" valign="top" border="5" border-width="10"| | |
| − | {|style= | + | |
| − | | style="font-family: | + | | style="font-family:'Garamond',font-size:100%; solid:#1B338F; background:#20517e; text-align:center;" width="16%" | |
; | ; | ||
[[Group25_Overview| <font color="#FFFFFF">OVERVIEW</font>]] | [[Group25_Overview| <font color="#FFFFFF">OVERVIEW</font>]] | ||
| − | | style="font-family: | + | | style="font-family:'Garamond', font-size:100%; solid #1B338F; background:#d16163; text-align:center;" width="16%" | |
; | ; | ||
| − | [[Group25_Proposal| <font color="#FFFFFF">PROPOSAL</font>]] | + | [[Group25_Proposal|<font color="#FFFFFF">PROPOSAL</font>]] |
| − | | style="font-family: | + | | style="font-family:'Garamond', font-size:100%; solid #1B338F; background:#20517e; text-align:center;" width="16%" | |
| + | ; | ||
| + | [[Group25_Analysis|<font color="#FFFFFF">ANALYSIS REPORT</font>]] | ||
| + | |||
| + | | style="font-family:'Garamond', font-size:100%; solid #1B338F; background:#20517e; text-align:center;" width="16%" | | ||
; | ; | ||
[[Group25_Poster| <font color="#FFFFFF">POSTER</font>]] | [[Group25_Poster| <font color="#FFFFFF">POSTER</font>]] | ||
| − | | style="font-family: | + | | style="font-family:'Garamond', font-size:100%; solid #1B338F; background:#20517e; text-align:center;" width="16%" | |
; | ; | ||
| + | |||
[[Group25_Application| <font color="#FFFFFF">APPLICATION</font>]] | [[Group25_Application| <font color="#FFFFFF">APPLICATION</font>]] | ||
| − | | style="font-family: | + | | style="font-family:'Garamond', font-size:100%; solid #1B338F; background:#20517e; text-align:center;" width="16%" | |
| − | ; | + | ; |
| − | [[ | + | [[Project Groups|<font color="#FFFFFF">ALL PROJECTS</font>]] |
| − | + | ||
|} | |} | ||
| Line 85: | Line 90: | ||
<!--Singapore_Bus--> | <!--Singapore_Bus--> | ||
| − | + | <br> | |
| − | <!-- | + | <!--Review and critic--> |
<div style="text-align:left;vertical-align:bottom;"> | <div style="text-align:left;vertical-align:bottom;"> | ||
| − | <font size = 6><span style="font-family:Century Gothic;"> | + | <font size = 6><span style="font-family:Century Gothic;">Review and critic</span></font> |
</div> | </div> | ||
| − | + | <br> | |
| − | + | One of the problem in working on optimizing the transit routes is the conflict of interest between operators and the bus commuters. While having a very connected and dense network is very beneficial for the passengers, building such a network can actually be very expensive to the operators. Thus, keeping the operators and the passengers on the same page can be really difficult and this is what actually leads to a not very optimal solution. | |
| − | + | Van Nes and bovy in (200)did a study on the importance of urban transit network design. They stated that six kinds of objective functions from the three main perspectives, the passenger, operator, and social welfare perspectives were mainly used in past studies. The objectives are listed below: | |
| − | # | + | # Minimize passenger time travel, which includes access time, waiting time and in vehicle time. |
| − | + | # Minimize passenger travel time given a limited budget. | |
| − | + | # Maximize cost effectiveness which is defined as the ratio of the total revenues minus operational cost. | |
| − | + | # Maximize operator profit which is the total revenues minus the operational cost. | |
| − | + | # Minimize the total cost that is the operational cost plus traveler cost. | |
| − | + | # Maximize the passenger load in the public transport. | |
| − | + | These six objectives were made into an analytical model based on an assumed urban area of one-kilometer square. This area was served with one or more parallel transit lines having uniform line spacing. The stop spacing for all the transit line was also uniform. The transit fares were fixed. The focus was on the influence of the objective on the resulting key design variables i.e. stop spacing and line spacing. After comparing the different network attractiveness and performance characteristics resulting from different objectives, Van Nes and Bovy concluded that minimizing the total cost was the most suitable objective in urban transit. | |
| − | + | There have been many other works as well on optimizing the Singapore transportation services and all of them are directed towards solving a different kind of problem. Among such works, There is a paper done by students of NTU. This project is tailored in a way of optimizing public bus transport network in Singapore using spatial parameters and demographic information | |
| − | + | Part of their research was on Travel Time Analysis, of which their main focus was on travel time to place of employment as the destination. With the necessary available demographic data from employment departments, they measured the travel time to inter-zone level. The average travel time to all employment zones by bus, ATEbusi is used as the measure of accessibility of bus services for zone i. | |
| − | + | {| width="100%" cellspacing="0" cellpadding="0" valign="top" border="0" | | |
| + | | style="text-align:center;" | | ||
| + | ; | ||
| + | [[File:Formula.png|200px]] | ||
| + | ; | ||
| + | |} | ||
| + | where Ej is employment in zone j, tijbus is travel time from zone i to zone j by bus. | ||
{| width="100%" cellspacing="0" cellpadding="0" valign="top" border="0" | | {| width="100%" cellspacing="0" cellpadding="0" valign="top" border="0" | | ||
| style="text-align:center;" | | | style="text-align:center;" | | ||
; | ; | ||
| − | [[File: | + | [[File:Mappp.png|600px]] |
; | ; | ||
|} | |} | ||
| + | Taking these use cases as references, we have based our research with new problem statements by studying if there is a need for rerouting of the bus routes by estimating the travel time and to explore the bus complexity through Network Model. | ||
| − | + | <!--Review and critics--> | |
| − | |||
| − | <!-- | ||
| − | |||
| − | |||
| − | |||
| − | |||
| − | |||
| − | |||
| − | |||
| − | |||
| − | |||
| − | |||
| − | |||
| − | |||
| − | |||
<!--DATASET--> | <!--DATASET--> | ||
<div style="text-align:left;vertical-align:bottom;padding-top:25px;"> | <div style="text-align:left;vertical-align:bottom;padding-top:25px;"> | ||
| Line 143: | Line 140: | ||
|} | |} | ||
<!--DATASET--> | <!--DATASET--> | ||
| − | + | <br> | |
<!--About Data Source--> | <!--About Data Source--> | ||
<div style="text-align:left;vertical-align:bottom;"> | <div style="text-align:left;vertical-align:bottom;"> | ||
| Line 150: | Line 147: | ||
Our data is collected using LTA's API to access their database and scrape the data by using Python. The dataset that we currently have are:<br> | Our data is collected using LTA's API to access their database and scrape the data by using Python. The dataset that we currently have are:<br> | ||
| − | <b>1. Singapore Bus Stops.</b><br> This dataset contains a list of all currently existed Bus Stops across whole Singapore. It contained 4,985 data consist of a unique code as well as the latitude and longitude coordinate for each Bus Stop. However, as the coordinate is based on WGS84(World Geodetic System), we have to convert the coordinate into a SYV21 system. Detailed step to convert will be explained in the report. | + | <b>1. Singapore Bus Stops.</b><br> This dataset contains a list of all currently existed Bus Stops across whole Singapore. It contained 4,985 data consist of a unique code as well as the latitude and longitude coordinate for each Bus Stop. However, as the coordinate is based on WGS84(World Geodetic System), we have to convert the coordinate into a SYV21 system. Detailed step to convert will be explained in the report. |
| + | |||
<br> | <br> | ||
| − | <b>2. Singapore Bus Routes.</b><br> This dataset contains a list of all route that Singapore bus currently have. It contained 25,959 data consist of bus stops code and the bus service number, as well as the distance between each bus stops that buses follow | + | <!--Singapore_Bus--> |
| + | <div style="text-align:center;vertical-align:bottom;padding-top:5px;"> | ||
| + | <font size = 5><span style="font-family:Century Gothic;">Singapore Bus Stops</span></font> | ||
| + | </div> | ||
| + | |||
| + | {| width="100%" cellspacing="0" cellpadding="0" valign="top" border="0" | | ||
| + | | style="text-align:center;" | | ||
| + | ; | ||
| + | [[File:Busstopdata.PNG|700px]] | ||
| + | ; | ||
| + | |} | ||
| + | |||
| + | <br><br> | ||
| + | <b>2. Singapore Bus Routes.</b><br> This dataset contains a list of all route that Singapore bus currently have. It contained 25,959 data consist of bus stops code and the bus service number, as well as the distance between each bus stops that buses follow. | ||
<br> | <br> | ||
| − | <b>3. Singapore Bus Services.</b><br> This dataset contains a list of all Singapore Bus that currently in service. It contained 1,410 data consist of buses code and the destination code for that bus | + | <!--Singapore_Bus--> |
| + | <div style="text-align:center;vertical-align:bottom;padding-top:5px;"> | ||
| + | <font size = 5><span style="font-family:Century Gothic;">Singapore Bus Routes</span></font> | ||
| + | </div> | ||
| + | |||
| + | {| width="100%" cellspacing="0" cellpadding="0" valign="top" border="0" | | ||
| + | | style="text-align:center;" | | ||
| + | ; | ||
| + | [[File:Busroute.PNG|700px]] | ||
| + | ; | ||
| + | |} | ||
| + | |||
| + | <br><br> | ||
| + | <b>3. Singapore Bus Services.</b><br> This dataset contains a list of all Singapore Bus that currently in service. It contained 1,410 data consist of buses code and the destination code for that bus. | ||
<br> | <br> | ||
| − | <b>4. MRT Stations coordinate.</b><br> This dataset contains coordinate of all Singapore MRT Stations. Unfortunately, the file is in SHP and we can only open one of them .SHP file using JMP. Therefore, there is no detail regarding the name of the MRT stations. We will have to manually match the data with the MRT Station in google map based on this coordinate. The coordinate is based on SVY21 system | + | <!--Singapore_Bus--> |
| + | <div style="text-align:center;vertical-align:bottom;padding-top:5px;"> | ||
| + | <font size = 5><span style="font-family:Century Gothic;">Singapore Bus Services</span></font> | ||
| + | </div> | ||
| + | |||
| + | {| width="100%" cellspacing="0" cellpadding="0" valign="top" border="0" | | ||
| + | | style="text-align:center;" | | ||
| + | ; | ||
| + | [[File:Busservice.PNG|700px]] | ||
| + | ; | ||
| + | |} | ||
| + | |||
| + | <br><br> | ||
| + | <b>4. MRT Stations coordinate.</b><br> This dataset contains coordinate of all Singapore MRT Stations. Unfortunately, the file is in SHP and we can only open one of them .SHP file using JMP. Therefore, there is no detail regarding the name of the MRT stations. We will have to manually match the data with the MRT Station in google map based on this coordinate. The coordinate is based on SVY21 system. | ||
<br> | <br> | ||
| + | <!--Singapore_Bus--> | ||
| + | <div style="text-align:center;vertical-align:bottom;padding-top:5px;"> | ||
| + | <font size = 5><span style="font-family:Century Gothic;">MRT Stations coordinate</span></font> | ||
| + | </div> | ||
| + | |||
| + | {| width="100%" cellspacing="0" cellpadding="0" valign="top" border="0" | | ||
| + | | style="text-align:center;" | | ||
| + | ; | ||
| + | [[File:Mrt.PNG|700px]] | ||
| + | ; | ||
| + | |} | ||
<!--Data Source--> | <!--Data Source--> | ||
Latest revision as of 22:08, 13 August 2018
|
|
|
|
|
|
|
Introduction
Buses forms a significant part of public transport in Singapore, Singapore's bus system has an extensive network of routes covering most places in Singapore, with over 3.9 million rides taken per day on average as of 2016, and is the most economical way to get around, as well as being one of the most scenics. There are more than 300 scheduled bus services, operated by SBS Transit, SMRT Buses, Tower Transit Singapore and Go-Ahead Singapore. The newest bus operator, Go-Ahead Singapore started operation from 4 September 2016. There are also around 4,600 buses currently in operation.
Transportation plays a cardinal role in escalating the mobility, prosperity, and connectivity of a community. The more the people are satisfied with the public transportation, the more they tend to use it. The more the people use public transportation, the higher are the chances of them not buying a personal vehicle. The higher the chances of people not buying a personal vehicle, the lesser we will see cars running on the road. The lesser the cars running on the road the lesser will be the pollution generated. So, If we look at the macro picture, we see that not only the society gets affected by public transportation system but also the whole world. And, everything then comes down to the satisfaction level of the people using it.
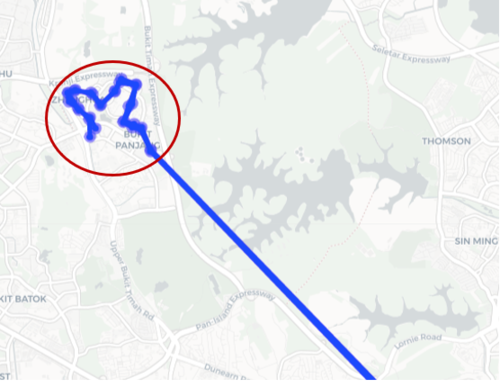
Our main objective in this project was to look for bus routes having similar looping pattern as bus 972 as shown below, we call such routes as problematic routes.
These problematic routes can result in a substantial waste of time for the people traveling from the starting point to its destination point as they have to unnecessary travel through all the bus stops in the loop until the bus takes the highway route. This futile traveling leads results in a waste of time, waste of money and bus overcrowdedness.
Example of the problematic bus route(Bus - 972)
|
|
Inspiration
According to Travel+Leisure and other such reputed websites, Singapore comes second in the list of top 15 countries with the best land transportation system. Because of the effective connectivity of bus stops and MRT stations, economic ticket rates and less traveling time, people usually go for using buses as their primary means of transport. As we can see below according to the data we found out that in the year 2016 48.2% of the total Singaporeans were using Buses and since then the numbers have been going up. This ever-increasing number of bus commuters require us to pay more attention towards making bus routes and buses more efficient for the commuters.
A peek into the proportion of people using different transportation and the trend of number of people using bus over the years
|
|
Review and critic
One of the problem in working on optimizing the transit routes is the conflict of interest between operators and the bus commuters. While having a very connected and dense network is very beneficial for the passengers, building such a network can actually be very expensive to the operators. Thus, keeping the operators and the passengers on the same page can be really difficult and this is what actually leads to a not very optimal solution.
Van Nes and bovy in (200)did a study on the importance of urban transit network design. They stated that six kinds of objective functions from the three main perspectives, the passenger, operator, and social welfare perspectives were mainly used in past studies. The objectives are listed below:
- Minimize passenger time travel, which includes access time, waiting time and in vehicle time.
- Minimize passenger travel time given a limited budget.
- Maximize cost effectiveness which is defined as the ratio of the total revenues minus operational cost.
- Maximize operator profit which is the total revenues minus the operational cost.
- Minimize the total cost that is the operational cost plus traveler cost.
- Maximize the passenger load in the public transport.
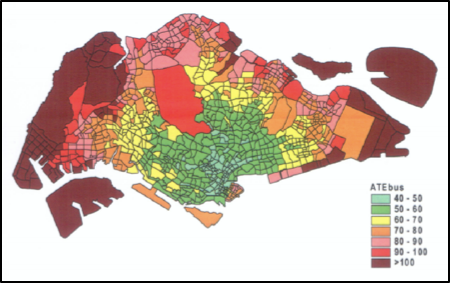
These six objectives were made into an analytical model based on an assumed urban area of one-kilometer square. This area was served with one or more parallel transit lines having uniform line spacing. The stop spacing for all the transit line was also uniform. The transit fares were fixed. The focus was on the influence of the objective on the resulting key design variables i.e. stop spacing and line spacing. After comparing the different network attractiveness and performance characteristics resulting from different objectives, Van Nes and Bovy concluded that minimizing the total cost was the most suitable objective in urban transit. There have been many other works as well on optimizing the Singapore transportation services and all of them are directed towards solving a different kind of problem. Among such works, There is a paper done by students of NTU. This project is tailored in a way of optimizing public bus transport network in Singapore using spatial parameters and demographic information Part of their research was on Travel Time Analysis, of which their main focus was on travel time to place of employment as the destination. With the necessary available demographic data from employment departments, they measured the travel time to inter-zone level. The average travel time to all employment zones by bus, ATEbusi is used as the measure of accessibility of bus services for zone i.
|
|
where Ej is employment in zone j, tijbus is travel time from zone i to zone j by bus.
|
|
Taking these use cases as references, we have based our research with new problem statements by studying if there is a need for rerouting of the bus routes by estimating the travel time and to explore the bus complexity through Network Model.
Source of Dataset
| Data | Source |
|---|---|
| Singapore Bus Stops | https://www.mytransport.sg/content/dam/datamall/datasets/LTA_DataMall_API_User_Guide.pdf |
| Singapore Bus Routes | https://www.mytransport.sg/content/dam/datamall/datasets/LTA_DataMall_API_User_Guide.pdf |
| Singapore Bus Services | https://www.mytransport.sg/content/dam/datamall/datasets/LTA_DataMall_API_User_Guide.pdf |
| MRT Stations coordinate | https://www.mytransport.sg/content/dam/datamall/datasets/LTA_DataMall_API_User_Guide.pdf |
About Dataset
Our data is collected using LTA's API to access their database and scrape the data by using Python. The dataset that we currently have are:
1. Singapore Bus Stops.
This dataset contains a list of all currently existed Bus Stops across whole Singapore. It contained 4,985 data consist of a unique code as well as the latitude and longitude coordinate for each Bus Stop. However, as the coordinate is based on WGS84(World Geodetic System), we have to convert the coordinate into a SYV21 system. Detailed step to convert will be explained in the report.
Singapore Bus Stops
|
|
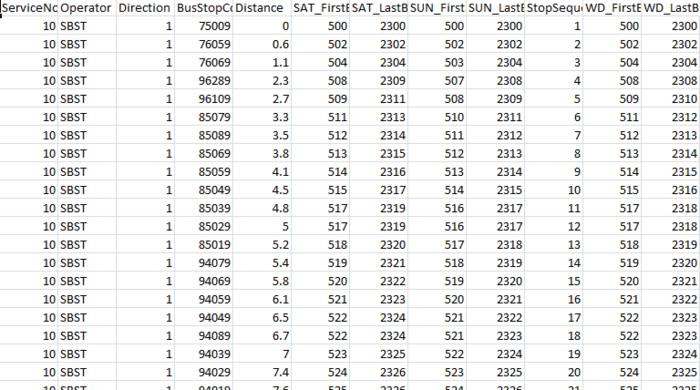
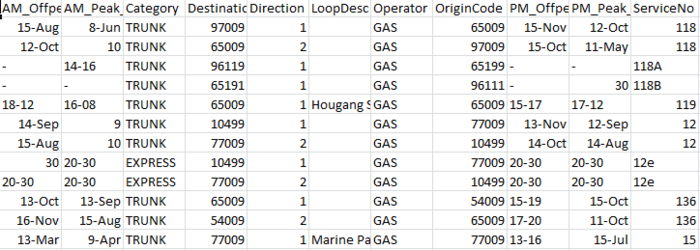
2. Singapore Bus Routes.
This dataset contains a list of all route that Singapore bus currently have. It contained 25,959 data consist of bus stops code and the bus service number, as well as the distance between each bus stops that buses follow.
Singapore Bus Routes
|
|
3. Singapore Bus Services.
This dataset contains a list of all Singapore Bus that currently in service. It contained 1,410 data consist of buses code and the destination code for that bus.
Singapore Bus Services
|
|
4. MRT Stations coordinate.
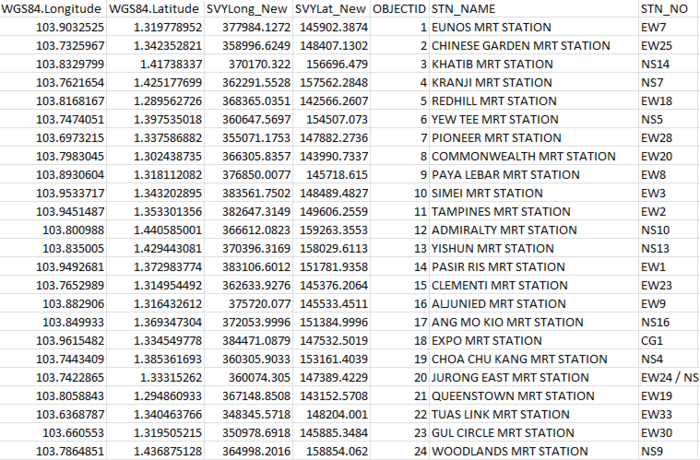
This dataset contains coordinate of all Singapore MRT Stations. Unfortunately, the file is in SHP and we can only open one of them .SHP file using JMP. Therefore, there is no detail regarding the name of the MRT stations. We will have to manually match the data with the MRT Station in google map based on this coordinate. The coordinate is based on SVY21 system.
MRT Stations coordinate
|
|
