Difference between revisions of "Group07 Proposal"
Yi.fu.2017 (talk | contribs) |
Orkhanh.2017 (talk | contribs) |
||
| (2 intermediate revisions by the same user not shown) | |||
| Line 1: | Line 1: | ||
<!--MAIN HEADER --> | <!--MAIN HEADER --> | ||
<div style="background-color:#006666;padding:30px"> | <div style="background-color:#006666;padding:30px"> | ||
| − | [[File:T7-MP.jpg| | + | [[File:T7-MP.jpg|300px|left]]<br> |
| − | <font size = | + | <font size = 10; color = #ffffff><span style="font-family:Helvetica;"><b>Be a REALIST</b><br></span></font> |
| − | <font size = | + | <font size = 6; color = #ffffff><span style="font-family:Helvetica;"><b>Uncover the Truth in Singapore Private Property Market</b></span></font> |
<br><br> | <br><br> | ||
</div> | </div> | ||
Latest revision as of 20:30, 13 August 2018
|
|
|
|
|
|
|
In Singapore, as well as many other nations of the world, housing markets are characterised by the co-existence of a freely priced part of the market with a part that is subject to varying degrees and forms of government intervention and regulation. The Singapore housing market has an especially complex institutional structure with its large regulated public housing sub-sectors. The private housing price are affected by the standard determinants of supply and demand as well as by many government policies, it varies from locations, years, property type, type of sales and influenced by factors like SIBOR. In the last 20+ years, the property price witnessed a roller coaster of change. URA-Media Releases Appendix. In the most recent 10 years, since Singapore economy rebounded back after 2008 financial crisis. As a result, Singapore Real Estate market price has been heating up significantly from 2009 onwards, until Singapore Government announced that the property tax rates will be made more progressive over two years from Jan 2014, the price had been cooled down.2014-2015 Singapore property tax changes
After a four-year slump until the end of 2017, the property market started to bounce back, and it has the trend that will go up even more. On the other hand, “the US Federal Reserve’s interest-rate has been increased 5 times since President Trump took office in Jan 2017”, says from Bloomberg news, “and there will be 2 more increase happen in 2018”. Trump Blasts Powell’s Rate Hikes, Trespassing on Fed’s Independence
This foreseeing news will have impact on Singapore economy in near future. How does this news will affect Singapore residential property price? As Singapore IRAS (Inland Revenue Authority of Singapore) made an announcement this February, says that the property tax will increase to 4% for property house price over 1 million SGD. But this policy seems did not affect Property market much Budget 2018-Overview tax changes. 6th July, the Additional Buyers' Stamp Duty (ABSD) increases drastically. ABSD-6th July In this February, officials stated that the new announcement for increasing BSD rate is not a cooling measure. Higher stamp duty not a cooling measure, say analysts. However, last month when ABSD rate increases even more, Channel News Asia reported that, Higher ABSD rate, the Coolijng measure
What is it all about? What does Singapore IRAS try to manipulate? How the Property price will change now?
Private housing prices in Singapore cannot be easily analysed by recourse either to analysis of private-sector supply and demand or simple trend-line forecasting. Therefore, it is imperative to analyse from a thorough perspective. However, there is a deficiency of Market Watch tool for analysing the real estate market data as well as the trends properly, these data are still in table formats and the visualizations are quite basic, most of trends are illustrated static, graphs are not explanatory enough to show a full picture of changes, which sets barriers for readers from getting any useful insights and findings.
To better understand how the Real Estate market price moves cross different type of sales, property types and planning areas in the last 20+ years, and to gain insight how SIBOR influences total unit sold. A tool that is capable to compare the market trends in different time period would be desirable.
Our team aims to build such a web visual analytics-driven application as a Market Watch tool by using Singapore Private Property Market as an example for readers to understand and compare the Property Market pattern changing overtime. The framework of the app can be easily reproduced for various statistics websites of governments and organizations.
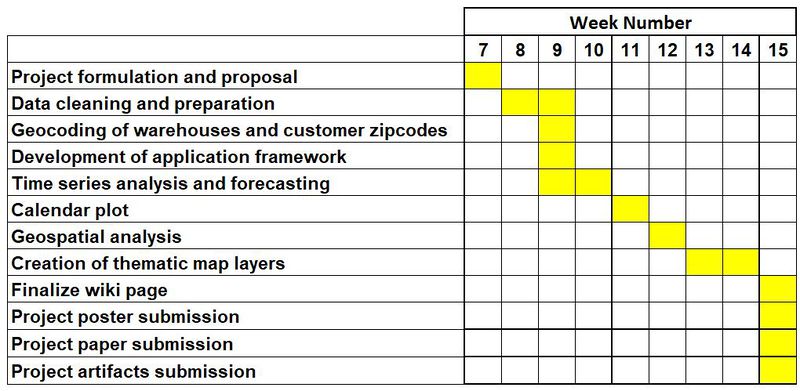
Our project consists of the following components :
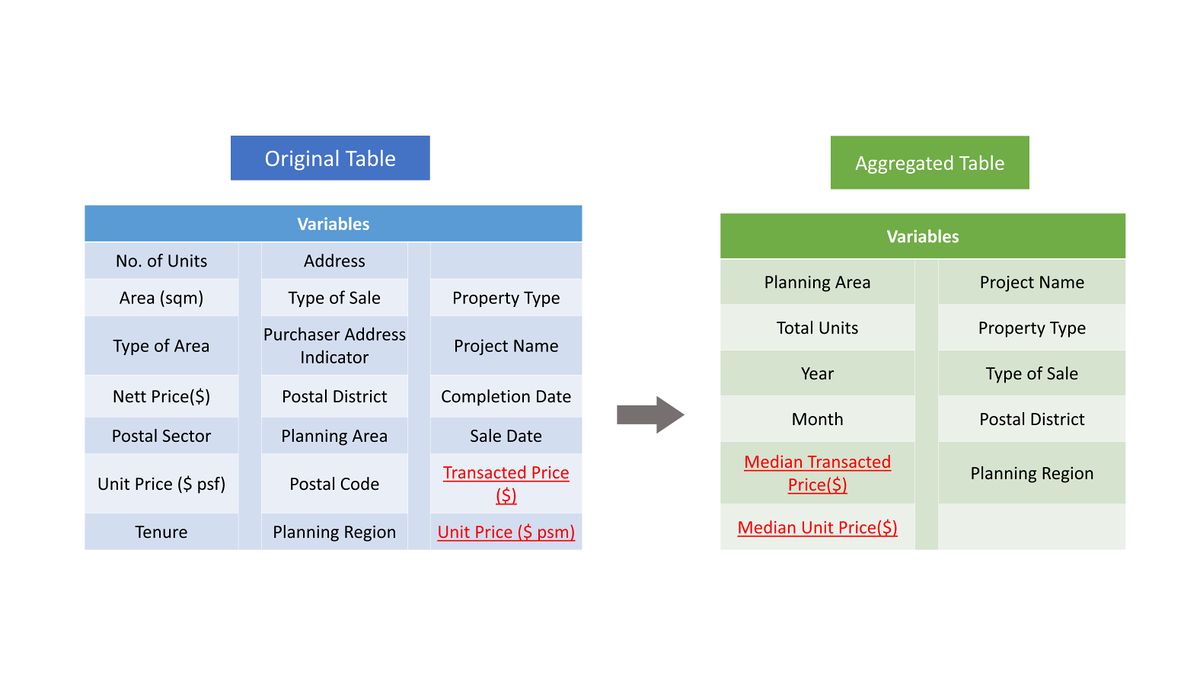
- Data cleaning and preparation: i) There are 24 tables hold private property transaction data in total, each table represent 1 year data. To consolidate all the tables, we aggregate 24 into one master table by using dplyr package, immediate operation and data-manipulation. ii) We bring 24-year SIBOR, an external dataset which affects property market transaction volume (Total Unit Sold).
- Choose the right R package to visualize: We had many brainstorming session in how to come out with an ideal interactive visualization application tool that we have in mind, we explore different system design and aesthetic principles learnt in our data visualization journey.
- Create Singapore grid: One of the plots we would like to visualize is named "Geofacet", it requires grids that form Singapore shape for both planning area and postal district perspective. However, there is no such grid published, we have to form grid by ourselves.
- Data visualization: In this stage, we use a Top-down strategy, guide our users to understand the property market thoroughly layer by layer, from a high-level overview, drill down to a very in-depth level that can generate informative insights. There are 4 levels in total, the sequence of the plots will be: Multi-axis plot -> Geofacet time-series -> Tree map & Ridge line plot -> LISA Geo-spatial analysis
Datasets are extracted from URA REALIS website from 1995 to 2018 https://spring-ura-gov-sg.libproxy.smu.edu.sg/lad/ore/property_market/index.cfm/
At the end of the project, we will submit the following deliverables:
- R Shiny web application
- Research paper
- Poster
- Project artifacts


