Difference between revisions of "ISSS608 2018-19 T3 Assign SAMEER PANDA DataPrep"
Jump to navigation
Jump to search
Sameerp.2017 (talk | contribs) |
Sameerp.2017 (talk | contribs) |
||
| (23 intermediate revisions by the same user not shown) | |||
| Line 28: | Line 28: | ||
| | | | ||
|} | |} | ||
| − | Data | + | <br /> |
| + | {|style="background-color:#FDFEFE;" width="100%" cellspacing="0" cellpadding="0" valign="top" border="0" | | ||
| + | | style="font-family:Verdana; font-size:100%; solid #1B338F; background:#0b3d53; text-align:center;" width="100%" | | ||
| + | ; | ||
| + | <font size = 3.75; font color="#FFFFFF"><span style="font-family:Verdana; font-size:100%; solid #1B338F; background:#0b3d53;">Significance of Data</span></font> | ||
| + | | | ||
| + | |} | ||
| + | <br /> | ||
| + | |||
| + | =<font size="4"><span style="font-family:Verdana;">'''Data Source'''</span></font>= | ||
| + | * <font size = 3.5><span style="font-family:Verdana;">The challenge is given by [http://www.vacommunity.org/tiki-index.php| Vast Analytic Community]. | ||
| + | </span></font> | ||
| + | * <font size = 3.5><span style="font-family:Verdana;">It serves as home for visual analytics discussions and emerging communities of research and practice. | ||
| + | </span></font> | ||
| + | * <font size = 3.5><span style="font-family:Verdana;">Data was given by VAST challenge [http://www.vacommunity.org/VAST+Challenge+2018+MC2| here]. | ||
| + | </span></font> | ||
<br/> | <br/> | ||
| − | Data | + | |
| + | =<font size="4"><span style="font-family:Verdana;">'''Files to work with'''</span></font>= | ||
| + | * <font size = 3.5><span style="font-family:Verdana;">Two csv files were received along with the image of a map: | ||
| + | **Boonsong Lekagul waterways readings.csv | ||
| + | **chemical units of measure.csv | ||
| + | **Waterways Final.jpg | ||
| + | </span></font> | ||
| + | <br/> | ||
| + | |||
| + | {|style="background-color:#FDFEFE;" width="100%" cellspacing="0" cellpadding="0" valign="top" border="0" | | ||
| + | | style="font-family:Verdana; font-size:100%; solid #1B338F; background:#0b3d53; text-align:center;" width="100%" | | ||
| + | ; | ||
| + | <font size = 3; font color="#FFFFFF"><span style="font-family:Verdana; font-size:100%; solid #1B338F; background:#0b3d53;">Enrichment</span></font> | ||
| + | | | ||
| + | |} | ||
| + | <br /> | ||
| + | =<font size="4"><span style="font-family:Verdana;">'''Data Cleaning'''</span></font>= | ||
| + | * <font size = 3.5><span style="font-family:Verdana;"> Dates were rectified from 2098 to 1998.<br/></span></font> | ||
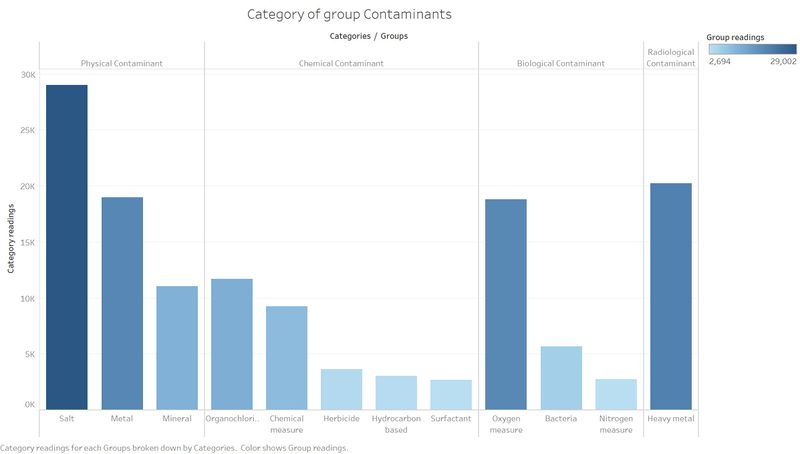
| + | * <font size = 3.5><span style="font-family:Verdana;">New groups were added to signify the named clusters of contaminants.</span></font> | ||
| + | [[Image:samtrend2.jpg|center|800px]] | ||
Latest revision as of 01:29, 9 July 2018
 VAST Challenge 2018: Like a Duck to Water
|
|
|
|
|
|
|
Significance of Data |
Data Source
- The challenge is given by Vast Analytic Community.
- It serves as home for visual analytics discussions and emerging communities of research and practice.
- Data was given by VAST challenge here.
Files to work with
- Two csv files were received along with the image of a map:
- Boonsong Lekagul waterways readings.csv
- chemical units of measure.csv
- Waterways Final.jpg
|
Enrichment |
Data Cleaning
- Dates were rectified from 2098 to 1998.
- New groups were added to signify the named clusters of contaminants.
