Difference between revisions of "Group04 Proposal"
| Line 1: | Line 1: | ||
| − | <div style="background:# | + | <div style="background:#00CD66; border:#002060; padding-left:15px; text-align:center;"> |
<font size = 5; color="#FFFFFF"><span style="font-family:Century Gothic;">An Analysis of Changing Rainfall Patterns Across India Through Visualizations | <font size = 5; color="#FFFFFF"><span style="font-family:Century Gothic;">An Analysis of Changing Rainfall Patterns Across India Through Visualizations | ||
| Line 5: | Line 5: | ||
</div> | </div> | ||
<!--MAIN HEADER --> | <!--MAIN HEADER --> | ||
| − | {|style="background-color:# | + | {|style="background-color:#00CD66;" width="100%" cellspacing="0" cellpadding="0" valign="top" border="0" | |
| − | | style="font-family:Century Gothic; font-size:100%; solid #1B338F; background:# | + | | style="font-family:Century Gothic; font-size:100%; solid #1B338F; background:#00CD66; text-align:center;" width="20%" | |
; | ; | ||
[[Group04_Overview| <font color="#FFFFFF">Overview</font>]] | [[Group04_Overview| <font color="#FFFFFF">Overview</font>]] | ||
| − | | style="font-family:Century Gothic; font-size:100%; solid #000000; background:# | + | | style="font-family:Century Gothic; font-size:100%; solid #000000; background:#008B45; text-align:center;" width="20%" | |
; | ; | ||
[[Group04_Proposal| <font color="#FFFFFF">Proposal</font>]] | [[Group04_Proposal| <font color="#FFFFFF">Proposal</font>]] | ||
| − | | style="font-family:Century Gothic; font-size:100%; solid #1B338F; background:# | + | | style="font-family:Century Gothic; font-size:100%; solid #1B338F; background:#00CD66; text-align:center;" width="20%" | |
; | ; | ||
[[Group04_Report| <font color="#FFFFFF">Analysis Report</font>]] | [[Group04_Report| <font color="#FFFFFF">Analysis Report</font>]] | ||
| − | | style="font-family:Century Gothic; font-size:100%; solid #1B338F; background:# | + | | style="font-family:Century Gothic; font-size:100%; solid #1B338F; background:#00CD66; text-align:center;" width="20%" | |
; | ; | ||
[[Group04_Poster| <font color="#FFFFFF">Poster</font>]] | [[Group04_Poster| <font color="#FFFFFF">Poster</font>]] | ||
| − | | style="font-family:Century Gothic; font-size:100%; solid #1B338F; background:# | + | | style="font-family:Century Gothic; font-size:100%; solid #1B338F; background:#00CD66; text-align:center;" width="20%" | |
; | ; | ||
[[Group04_Application| <font color="#FFFFFF">Application</font>]] | [[Group04_Application| <font color="#FFFFFF">Application</font>]] | ||
| Line 96: | Line 96: | ||
<font size = 5><span style="font-family:Century Gothic;">Key Milestones</span></font> | <font size = 5><span style="font-family:Century Gothic;">Key Milestones</span></font> | ||
</div> | </div> | ||
| + | |||
| + | {| width="100%" cellspacing="0" cellpadding="0" valign="top" border="0" | | ||
| + | | style="text-align:center;" | | ||
| + | ; | ||
| + | [[ProjectMilestones.png]] | ||
| + | ; | ||
| + | |} | ||
<!--PROJECT EXECUTION PLAN--> | <!--PROJECT EXECUTION PLAN--> | ||
Revision as of 21:38, 15 June 2018
An Analysis of Changing Rainfall Patterns Across India Through Visualizations
|
|
|
|
|
|
Introduction
With growing fluctuations in climate in recent years, one occupation that has been affected the most is Agriculture. This has turned into a global concern and particularly in India where these climate changes have contributed significantly in the growing rate of farmers taking their lives.
In this study, we intend to analyse India’s rainfall patters for past few years using Exploratory techniques. Over 80% of the annual rainfall is received in the four rainy months of June to September. There is great regional and temporal variation in the distribution of rainfall and although the monsoons affect most parts of India, the amount of rainfall varies from heavy to scanty on different parts. The primary motive of our analysis is to scrutinize the effect of irregularities in the rainfall pattern on crop yield in agriculture sector in India and in turn attempt to discover any relation between the growing rate of suicides amongst farmers. Through our visualizations, we would like to derive meaningful insights that foster our understanding about how climactic changes have an influence on various factors including socioeconomic factors that might lead to these suicidal attempts.
Inspiration
According to the National Crime Records Bureau (NCRB) of India as of 2015, at least 270,940 Indian farmers have committed suicide since 1995 resulting in an average 46 suicides a day. Going beyond the political issue that this has transformed into, farmer suicides is a sensitive matter that calls for attention and needs to be analysed in detail.
Although, agriculture contributes 14% in the Gross Domestic Product (GDP) in India, 64% of the population depends on agriculture for their livelihood. A new study suggests that India will see more erratic whether events in the coming years bringing more drought and more storms which makes it vitally important to study historical data to understand future better. This analysis is an honest endeavour in gaining deeper knowledge into the impact of increasingly changing whether trends so that we can be prepared to mitigate the risk of these uncontrollable factors and seek remedies that would help sustain such drastic natural phenomenon.
Key Objectives
The objective of this project is to analyze the rainfall pattern changes in India and to find out how it is affecting India’s overall Agricultural production. Also, we will try to find out if there is any correlation between changing rainfall patterns and farmer’s suicide cases happening in India.
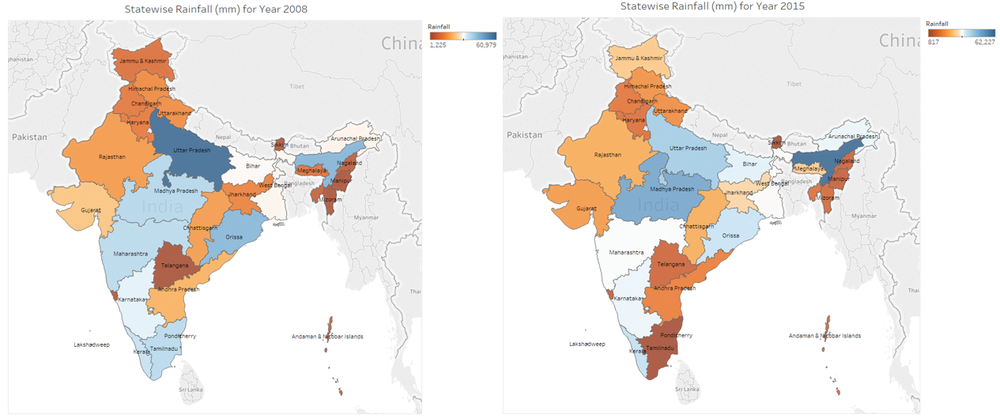
A Glance At The State-Wise Rainfall Patterns Across India for Years 2008 and 2015
|
|
Description of Dataset
| Data | Format | Source |
|---|---|---|
| Rainfall Pattern district-wise | xls | http://hydro.imd.gov.in/hydrometweb/(S(lf11dr45dr2w0czzyvrhep55))/DistrictRaifall.aspx |
| District-wise & Season-wise Crop Production | xls | https://data.gov.in/catalog/district-wise-season-wise-crop-production-statistics |
| Farmer Suicide Data 2015 | xls | https://data.gov.in/resources/farmers-suicide-data-period-2011-2014-ministry-agriculture-and-farmers-welfare |
Key Milestones
|
|
Expected Challenges
1. Data collection – we are still in the process of data collection. We are collecting data from various sources and will be integrating it together before analysis.
2. Steep learning curve – there is a steep learning curve involved in working with R-Shiny, SAS JMP Pro and Tableau.
3. Correlation between rainfall pattern and farmer’s suicide – Even though it is apparent that changes in the rainfall pattern over past few years affecting agriculture industry in India and increasing farmer’s worries, discovering direct correlation between rainfall pattern and farmer’s suicide is challenging.
References
