Difference between revisions of "ISSS608 2017-18 T3 Assign Low Zhi Wei Conclusion"
m |
|||
| (7 intermediate revisions by the same user not shown) | |||
| Line 54: | Line 54: | ||
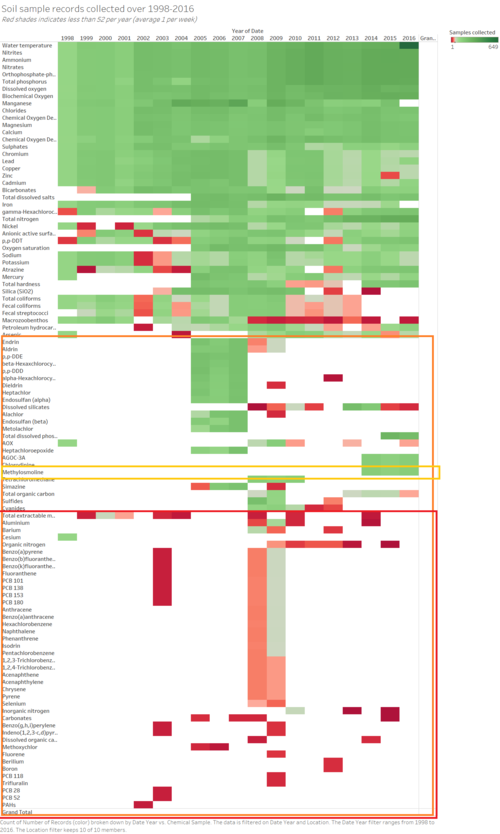
Data sparsity for Methylosmoline readings can already be noted from the earlier heat map, where there are multiple obvious gaps in measurement, which is crucial given it is the key chemical of interest for this exercise. | Data sparsity for Methylosmoline readings can already be noted from the earlier heat map, where there are multiple obvious gaps in measurement, which is crucial given it is the key chemical of interest for this exercise. | ||
| + | |||
[[Image:ZW-Map Methylosmoline.png | 500px]] | [[Image:ZW-Map Methylosmoline.png | 500px]] | ||
| Line 97: | Line 98: | ||
# Regular frequency of collection - for practical reasons, daily intervals can be avoided. Instead, a bare minimum of weekly collections should be done. | # Regular frequency of collection - for practical reasons, daily intervals can be avoided. Instead, a bare minimum of weekly collections should be done. | ||
# Consistent record-keeping - regardless of whether a chemical is detected, it should be recorded and assigned a value (zero for not detected) | # Consistent record-keeping - regardless of whether a chemical is detected, it should be recorded and assigned a value (zero for not detected) | ||
| + | # Consistent collection across locations - each location's chemical readings should have a corresponding reading at every other location, to provide a strong benchmark for comparison and analysis of trends | ||
At the same time, existing actions can already be taken to improve the quality of the data for analysis: | At the same time, existing actions can already be taken to improve the quality of the data for analysis: | ||
| − | # A data dictionary should be established - including information on each chemical's description, collection process, measurement units, | + | # A data dictionary should be established - including information on each chemical's description, whether they are toxic, description of the collection process, rationale for choice of measurement units, existing chemical relationships, for example, subsets or compounds and their sub-compounds. This will aid non-scientists of the field and guide them in analysis |
# Records (if available) of ecological events occurring, with description of the event and impact on the environment | # Records (if available) of ecological events occurring, with description of the event and impact on the environment | ||
# Provision of any other data, including past analyses, additional data on wildlife and contribution to chemical composition in soil etc | # Provision of any other data, including past analyses, additional data on wildlife and contribution to chemical composition in soil etc | ||
===<font color = "#326569">Q3 - Impact on the Pipit and Sampling Strategy</font>=== | ===<font color = "#326569">Q3 - Impact on the Pipit and Sampling Strategy</font>=== | ||
| + | Due to severe data deficiencies as noted earlier, several of the findings are anecdotal at best, and inconclusive at worst. However, they do open up a direction of where and how to tackle the toxic contamination situation. | ||
| + | |||
| + | Firstly, the data collection process should be robust, methodological and strictly adhered to. Next, certain findings hint at areas requiring further investigation to verify. These include: | ||
| + | *Detecting the existence of separate dumping grounds | ||
| + | *Understanding the relationship between Methylosmoline and other chemicals in the soil | ||
| + | *Understanding the environment of key locations with multiple outliers, such as Kohsoom and Tansanee | ||
| + | |||
| + | In addition, the sampling strategy can also be reviewed for consideration of the following: | ||
| + | *Continued collection of the AGOC-3A chemical and monitoring its impact to the environment. With close monitoring, the reserve and scientists can quickly respond to changes should the chemical turn out to be detrimental to wildlife | ||
| + | *Other than simply soil sample collection, the waterways provide a potential huge wealth of data which is highly relevant to the reserve given its extensive network of waterways. Complementing soil analysis with water data will greatly improve insights to the health of the reserve. At the same time, water is highly difficult to tamper with compared to soil, as evidenced by the recent efforts by Kasios | ||
| + | *If funds permit, animal stool sample analysis will also provide a new dimension to understanding the chemical make up and health of the reserve. | ||
| + | *A cheaper method of enhancing the data collection could be to also include plant samples and observations on their health | ||
| − | |||
| − | |||
==<font color = "#326569">Concluding remarks</font>== | ==<font color = "#326569">Concluding remarks</font>== | ||
| − | + | ||
| + | Acknowledgements: | ||
| + | * Created by Low Zhi Wei, contact at zhiwei.low.2017@mitb.smu.edu.sg | ||
| + | * Thanks to Prof Kam Tin Seong, contact at tskam@smu.edu.sg | ||
| + | |||
| + | |||
| + | Please feel free to leave your comments below. Or visit the [https://public.tableau.com/profile/low.zhi.wei#!/vizhome/WorkingFile_3/Mapview visusalisations in Tableau] to leave your comments. | ||
| + | |||
| + | All feedback are welcome, thank you :) | ||
Latest revision as of 23:54, 8 July 2018
Contents
Answering the important questions
Q1 - Trends of possible interest
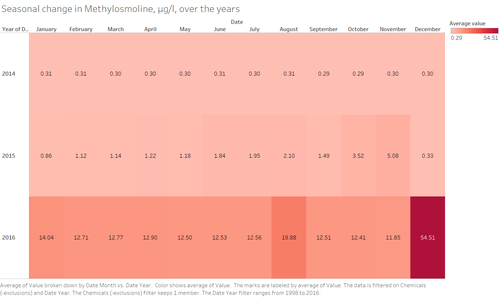
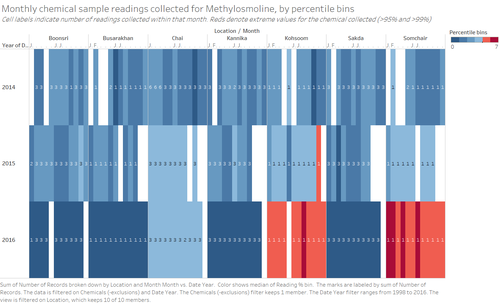
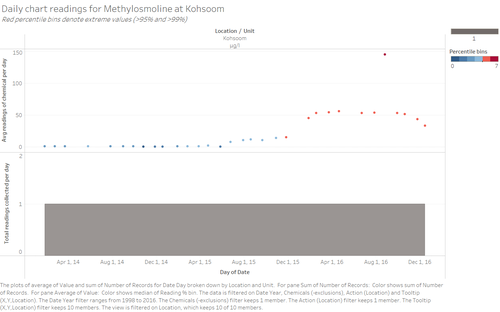
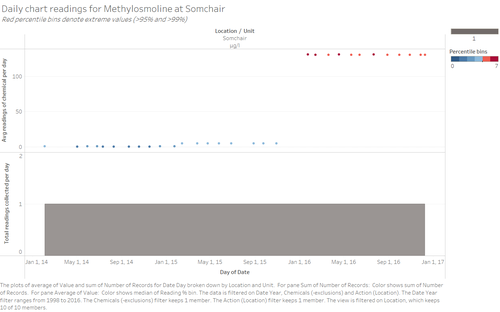
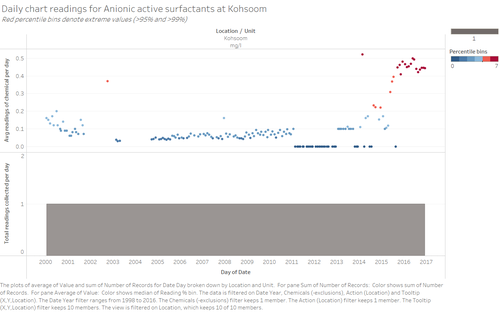
A key finding on Methylosmoline indicates that its amounts have greatly increased in the whole of 2016. These are largely attributed to increases in Kohsoom and Somchair. This was shown in the 2 charts below:
Most concerning is the fact that the increases in Methylosmoline seem to be more greatly contributed by increases at Somchair as shown in the 2 charts below. It is situated significantly further from the site of alleged waste dumping, and does not share any waterways Kohsoom. This could possibly point to the existence of another dumping ground for Methylosmoline which is currently unknown.
From earlier analyses, it has already been noted that Kohsoom is a location of interest given its proximity to the alleged dumping grounds, and the commonality between multiple chemical reading outliers. The most significant of these would be the increases in Anionic active surfactants which show sustained increases which coincide with the increases of Methylosmoline. There is a case to investigate deeper on Kohsoom - on why it houses such abnormalities, as well as the relationship between Methylosmoline and Anionic active surfactants.
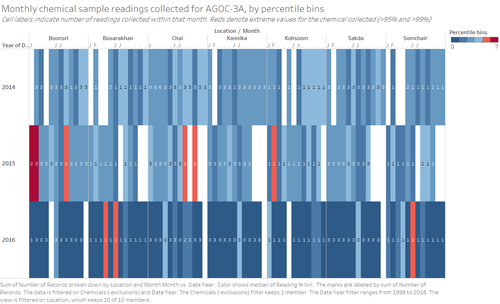
Lastly, it is important to continue monitoring of the AGOC-3A chemical which is touted by Kasios as a eco-friendly replacement to Methylosmoline, and to use the data for potential comparisons on other soil impacts. At this point in time, while data is few, it is worthwhile to note that concentrations of this chemical is low and have even dipped lower in 2016, coinciding with the increase in Methylosmoline that year.
Q2 - Data Anomalies and the Sampling Process
There were several anomalies noted in the data provided. Of these, a few significant ones to note would be:
- Data sparsity for Methylosmoline readings
- General data deficiencies across majority of chemicals
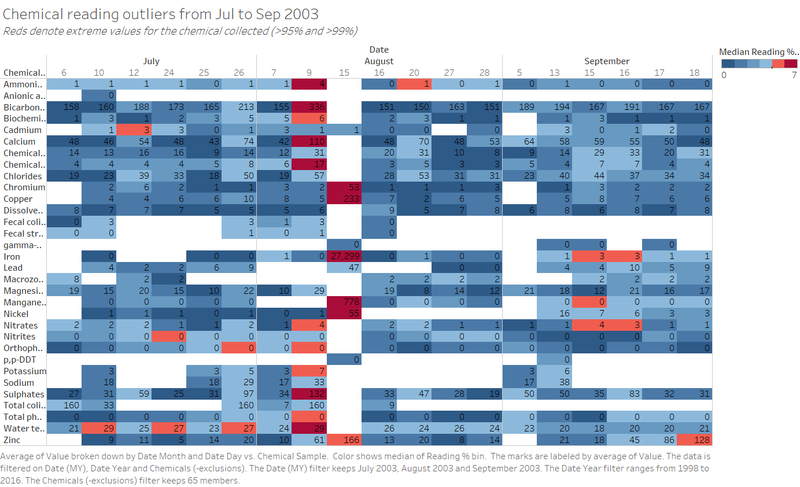
- The sudden and enormous increase of metals in readings for 15 August 2003
Data sparsity for Methylosmoline readings can already be noted from the earlier heat map, where there are multiple obvious gaps in measurement, which is crucial given it is the key chemical of interest for this exercise.
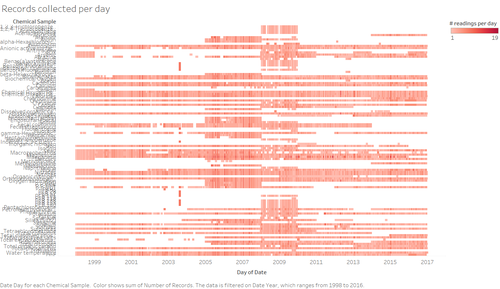
Data deficiency can be seen from visualising the total records collected with added perspective of breakdown by years. Also, most of the readings collected are only done one at a time, per day, instead of collecting a few to corroborate. These presents challenges in comparison of data values, as well as lowers the reliability of interpreting outliers.
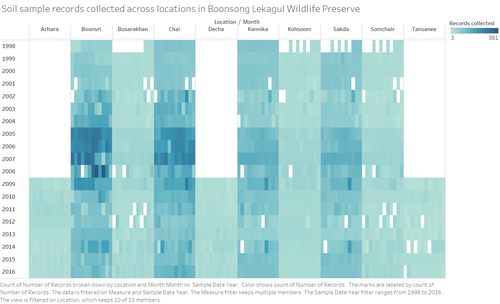
In addition, the data is not evenly collected across all locations as can be seen from the table below. The lack of consistency further hinders comparison efforts and understanding of trends.
| Location | No. of records |
|---|---|
| Achara | 2855 |
| Boonsri | 31314 |
| Busarakhan | 7492 |
| Chai | 31245 |
| Decha | 2731 |
| Kannika | 22152 |
| Kohsoom | 7895 |
| Sakda | 21429 |
| Somchair | 7537 |
| Tansanee | 2174 |
These data deficiencies lead to an incomplete and non-conclusive analysis on major patterns in the entire data, such as the single day increase in metals readings with no further residual impact.
Improving the Sampling Process
To address the data deficiency issues moving forward, the following measures can be implemented:
- Minimum number of chemical records at any one point of collection - For corroboration of values a useful benchmark could be 3 to 5.
- Regular frequency of collection - for practical reasons, daily intervals can be avoided. Instead, a bare minimum of weekly collections should be done.
- Consistent record-keeping - regardless of whether a chemical is detected, it should be recorded and assigned a value (zero for not detected)
- Consistent collection across locations - each location's chemical readings should have a corresponding reading at every other location, to provide a strong benchmark for comparison and analysis of trends
At the same time, existing actions can already be taken to improve the quality of the data for analysis:
- A data dictionary should be established - including information on each chemical's description, whether they are toxic, description of the collection process, rationale for choice of measurement units, existing chemical relationships, for example, subsets or compounds and their sub-compounds. This will aid non-scientists of the field and guide them in analysis
- Records (if available) of ecological events occurring, with description of the event and impact on the environment
- Provision of any other data, including past analyses, additional data on wildlife and contribution to chemical composition in soil etc
Q3 - Impact on the Pipit and Sampling Strategy
Due to severe data deficiencies as noted earlier, several of the findings are anecdotal at best, and inconclusive at worst. However, they do open up a direction of where and how to tackle the toxic contamination situation.
Firstly, the data collection process should be robust, methodological and strictly adhered to. Next, certain findings hint at areas requiring further investigation to verify. These include:
- Detecting the existence of separate dumping grounds
- Understanding the relationship between Methylosmoline and other chemicals in the soil
- Understanding the environment of key locations with multiple outliers, such as Kohsoom and Tansanee
In addition, the sampling strategy can also be reviewed for consideration of the following:
- Continued collection of the AGOC-3A chemical and monitoring its impact to the environment. With close monitoring, the reserve and scientists can quickly respond to changes should the chemical turn out to be detrimental to wildlife
- Other than simply soil sample collection, the waterways provide a potential huge wealth of data which is highly relevant to the reserve given its extensive network of waterways. Complementing soil analysis with water data will greatly improve insights to the health of the reserve. At the same time, water is highly difficult to tamper with compared to soil, as evidenced by the recent efforts by Kasios
- If funds permit, animal stool sample analysis will also provide a new dimension to understanding the chemical make up and health of the reserve.
- A cheaper method of enhancing the data collection could be to also include plant samples and observations on their health
Concluding remarks
Acknowledgements:
- Created by Low Zhi Wei, contact at zhiwei.low.2017@mitb.smu.edu.sg
- Thanks to Prof Kam Tin Seong, contact at tskam@smu.edu.sg
Please feel free to leave your comments below. Or visit the visusalisations in Tableau to leave your comments.
All feedback are welcome, thank you :)
