Difference between revisions of "ISSS608 2017-18 T3 Assign Low Zhi Wei Visualisations"
| Line 156: | Line 156: | ||
| − | =<font color = "#326569">Findings 5 - Other | + | =<font color = "#326569">Findings 5 - Other abnormalities of interest</font>= |
| + | A few remaining chemicals have been noted with various atypical patterns in readings. These have been grouped together and presented below. | ||
| + | |||
| + | |||
| + | #Magnesium | ||
| + | |||
| + | the year 2011 shows | ||
| + | |||
| − | |||
#Chlorides mg consistent high at Tansanee, spikes at Sakda - lack of previous readings for comparison | #Chlorides mg consistent high at Tansanee, spikes at Sakda - lack of previous readings for comparison | ||
#Orthophosphate-phosphorus mg - small, kohsoom, boonsri, achara | #Orthophosphate-phosphorus mg - small, kohsoom, boonsri, achara | ||
#AGOC-3A Boonsri | #AGOC-3A Boonsri | ||
Revision as of 21:14, 8 July 2018
Through the use of a few specific types of visualisations, and a deep-dive into each individual chemical, a few findings and insights were uncovered around the climate of the reserve, potential gaps and opportunities of improvement for sampling, fluctuations in Methylosmoline, and some other chemicals of interest. These findings are presented below.
Contents
Findings 1 - Climate
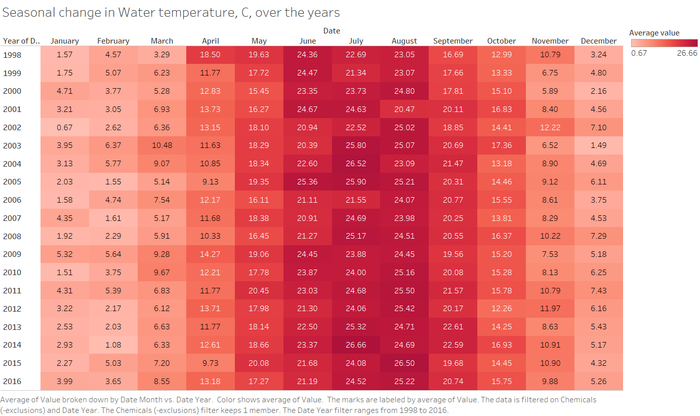
The water temperature varies seasonally over each year. This makes sense intuitively as the temperature of water would rise and fall in accordance to climate changes. From the chart below, warmer parts of the year are from June to August, while the cold months are from December to February.
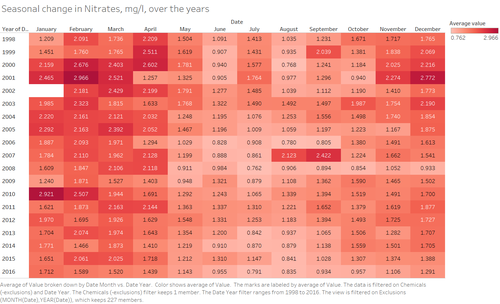
Impact on other chemicals
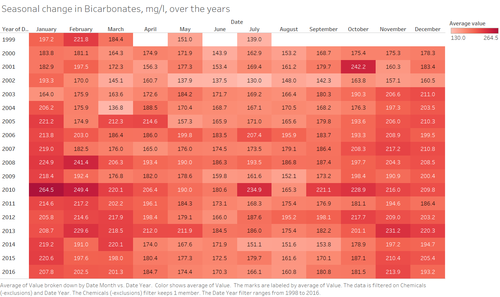
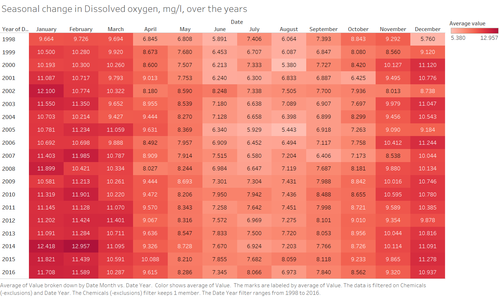
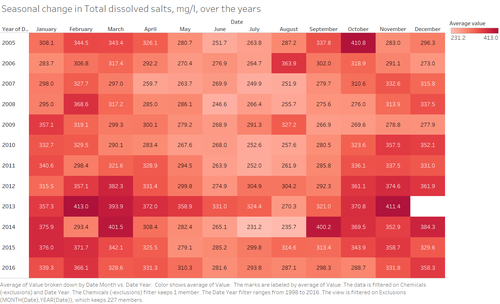
With the variations in climate, there also appears to be a similar but inverse pattern of variation on a few chemicals, which hints that temperature of the environment may have a subtle effect on the naturally occurring quantities of these chemicals in the soil.
Note: Uppermost extreme values for Total dissolved salts and Nitrates were excluded to enable greater visual differentiation of intra-year variations.
Findings 2 - Data outliers and potential sampling issues
While this exercise seeks to find patterns of interest, which includes extremities in fluctuations, it is important to also be mindful of the fact that such outliers may be potential errors arising from inherent data deficiencies.
The following charts present a few outliers which are suspect, and in totality points to a serious problem with the sample collection process and methodology. The issues uncovered on the data present a huge challenge in analysis, underscoring an urgent need to be addressed in order to progress the agenda against toxic pollutors.
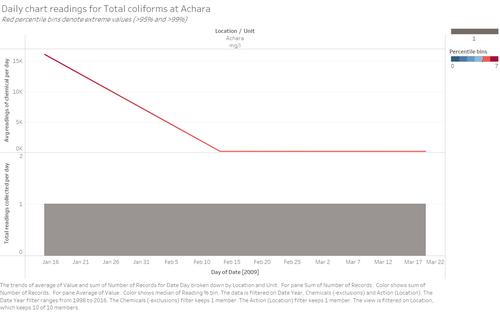
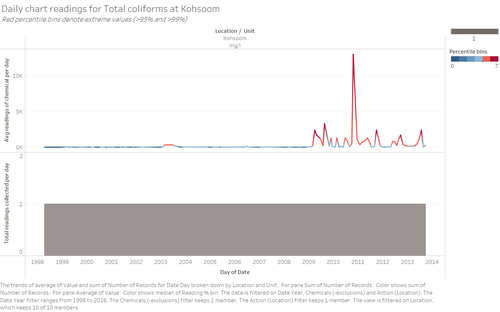
Total Coliforms
Key outliers in question:
- Reading for Total Coliforms in Achara on 15 Jan 2009 indicates a value of 16090 mg/l.
- Reading for Total Coliforms in Kohsoom on 20 Oct 2010 indicates a value of 13000 mg/l.
In comparison, most of the values for the other readings fall below 1000 mg/l. Considering the unit of measure, the increase is effectively more than 10 grams per litre. At both locations, the daily sample collected is only 1 per day, so there is no additional data to corroborate the evidence or rule out errors in sample collection. In the case of Achara, there are also only a total of 3 readings over the entire span of 18 years which creates an absence of benchmark norms for comparison. Given the circumstances, it is risky to draw any conclusions from these 2 outliers.
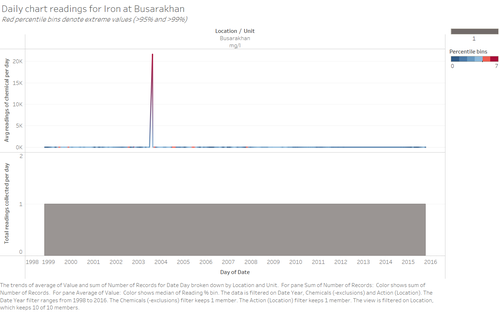
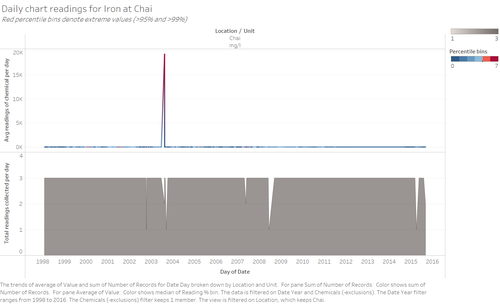
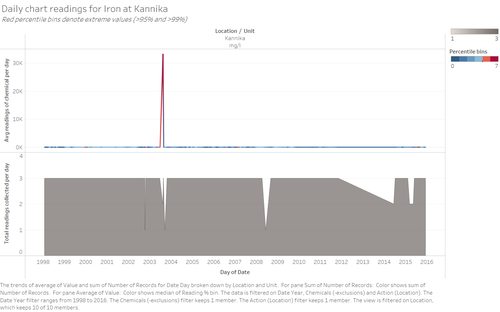
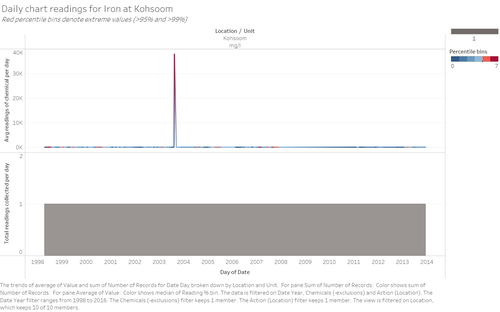
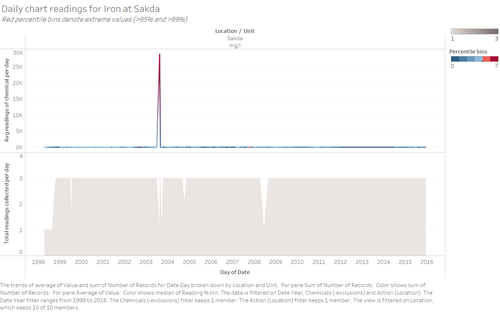
Iron
Key outliers in question:
- Reading for Iron in Busarkhan on 15 Aug 2003 indicates a value of 21666 mg/l.
- Reading for Iron in Chai on 15 Aug 2003 indicates a value of 19329 mg/l.
- Reading for Iron in Kannika on 15 Aug 2003 indicates a value of 33208 mg/l.
- Reading for Iron in Kohsoom on 15 Aug 2003 indicates a value of 37959 mg/l.
- Reading for Iron in Sakda on 15 Aug 2003 indicates a value of 28902 mg/l.
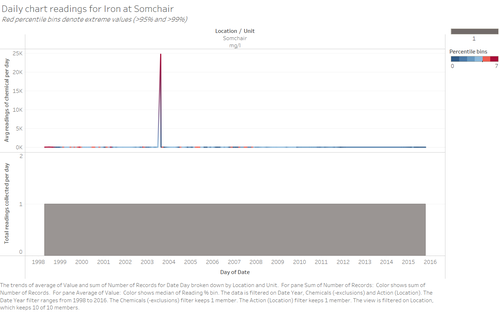
- Reading for Iron in Somchair on 15 Aug 2003 indicates a value of 24791 mg/l.
The immediate observation is that the outliers all coincide on the same day of measurement. This indicates either the possibility of a macro-level event which resulted in a massive release of Iron into the soil, or an error in the sampling to testing process to determine the values for Iron. In the case of the former, it is reasonable to expect such a large-scale event to also have a longer lasting impact on the soil as chemicals do not biodegrade overnight or a few days. However, the outliers exist simply on their own with no signs of high readings in the following collected samples.
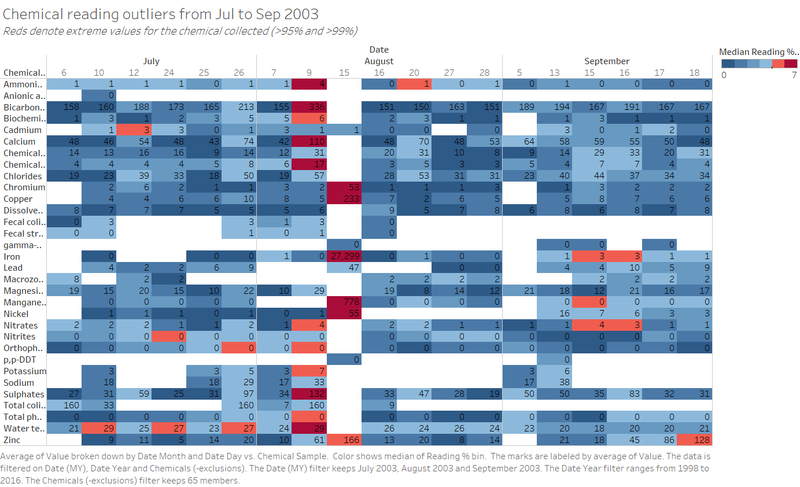
Metals and 15 Aug 2003
With the assumption that a large-scale event should have other indicators of residual impact, further investigation into the date was conducted. Comparing readings in the neighbourhood of the date, the following chart illustrates the impact of this event - all other metals (Chromium, Copper, Manganese, Nickel, and Zinc) also registered a large spike in their respective readings. Yet, these outliers also existed on their own with no higher readings in the following collections. This defies logic from an ecological perspective, so it is more likely determined to be an error with the sampling collection process.
Zinc
The final suspect outlier:
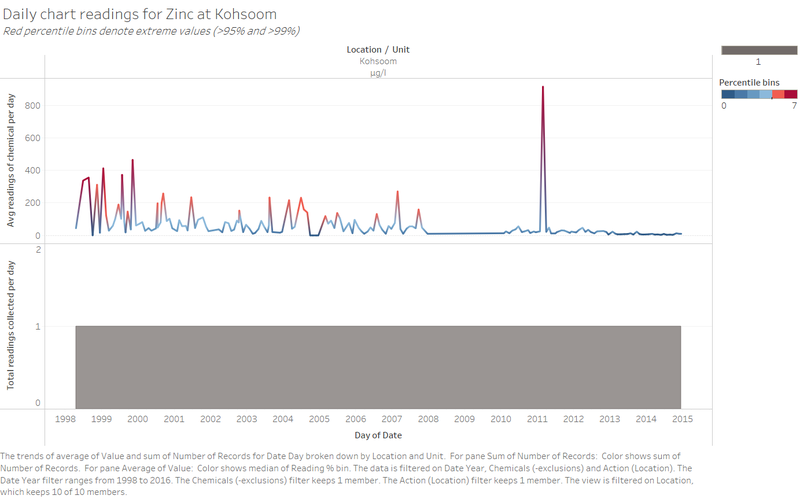
- Reading for Zinc in Kohsoom on 25 Feb 2011 indicates a value of 915 mg/l.
Similar to the evaluation for Total coliforms, there only exists 1 sample reading per day for Zinc. This lack of corroborative evidence casts a strong shadow of doubt on the legitimacy of this outlier being an actual significant ecological event with impact to the wildlife.
Findings 3 - Abnormalities in Kohsoom
Other than the above outliers, there are several other chemical readings with observations that appear to indicate some form of ecological impact on the soil. Amongst these, a commonality was noticed in their location which was Kohsoom. While some of them still suffer from some form of data deficiency, the fact that the observations and patterns displayed were common to Kohsoom warrants additional investigation and understanding of the causes. The featured chemicals are also found to be measured in mg/l, a unit of measurement larger than µg/l by 3 orders of magnitude. Thus, any significant increases may call for greater caution and attention. Given the close proximity of Kohsoom to the suspected site of waste dumping, it would be prudent to verify fluctuations of chemicals in the soil in this area.
It is important to note that despite these observations, they do not prove or support the case of chemical contamination, as soil changes may be due in part to certain wildlife changes in the environment (for example, unique species inhabiting Kohsoom) or contributed by other random non-threatening human activities specific to Kohsoom.
Sustained increases
Four chemicals were noted to have sustained increases in their readings after spikes at Kohsoom, indicating some form of external causes which led to higher amounts of chemical remnants. These are:
- Anionic active surfactants (mg/l)
- Chemical Oxygen Demand (Cr) (mg/l)
- Fecal coliforms (mg/l)
- Fecal streptococci (mg/l)
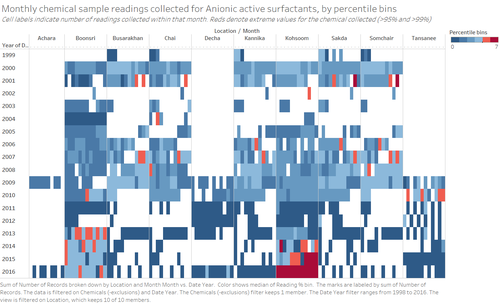
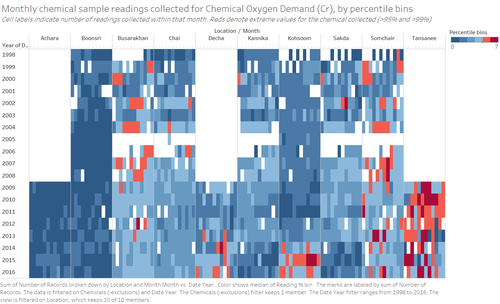
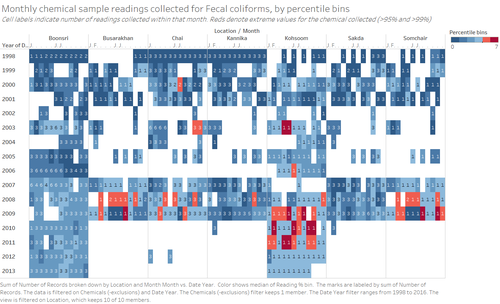
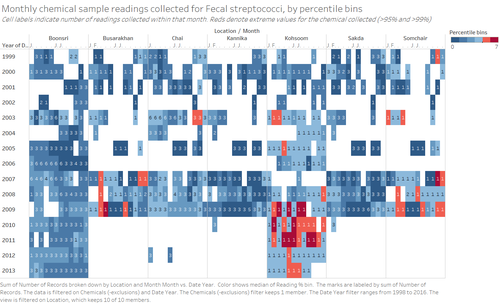
A quick view of their respective maps of monthly readings over time clearly show Kohsoom as a location of interest (For 2, Busarakhan and Tansanee are also noted as areas which stand out)
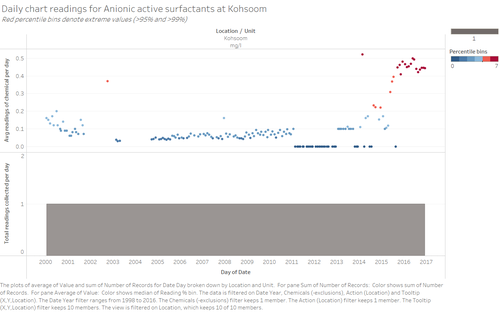
Anionic active surfactants
The data for this chemical indicates an increase since early 2014, and further abnormally high readings all the way into most of 2016. A closer look at its timechart shows a general increasing pattern since 2014.
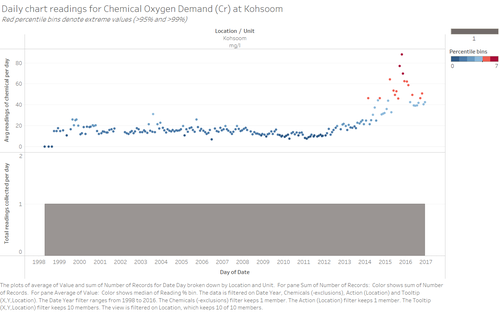
Chemical Oxygen Demand (Cr)
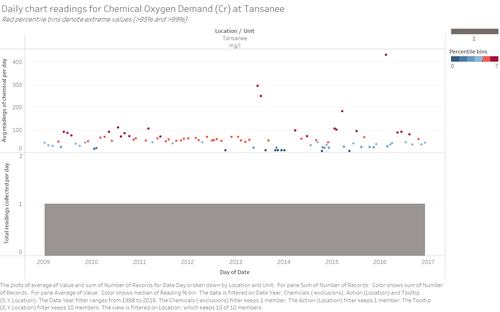
The readings for Chemical Oxygen Demand (Cr) show a sustained rising trend after an initial spike in February 2014, similar to Anionic active surfactants. It is also interesting to note that at Tansanee, the average readings are much higher than all other locations - typically close to 100mg/l with spikes reaching as high as 431mg/l.
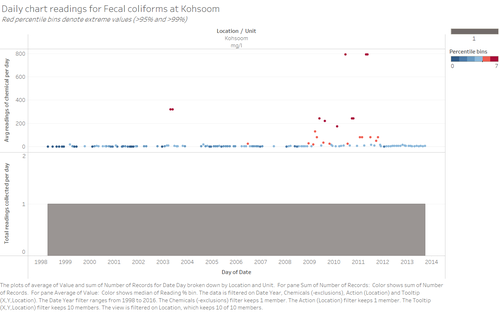
Fecal coliforms
Data for Fecal coliforms highlight abnormal increases and spikes from 29 March 2009. The same appeared for Busarakhan and Somchair, however readings were cut after 2009, preventing any form of comparison in values after.
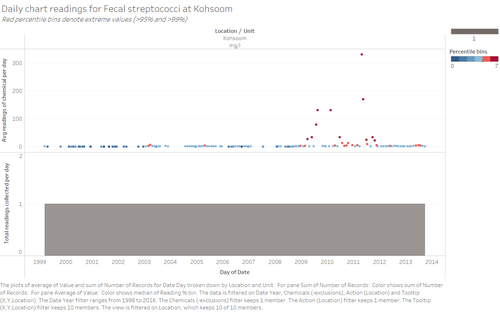
Fecal streptococci
Fecal streptococci has registered sustained increases after spiking on 29 March 2009, with values far exceeding the norm at Kohsoom. While similar patterns seem to appear at 2 other locations Busarakhan and Somchair, the sparsity of their readings in those locations pose a challenge in any meaningful or significant interpretation. It is interesting to note that this pattern, dates and locations coincide with that for Fecal coliforms, which was covered earlier.
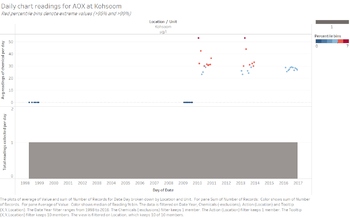
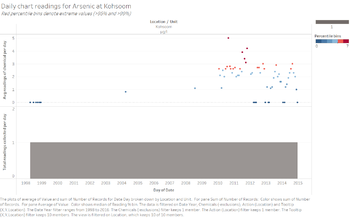
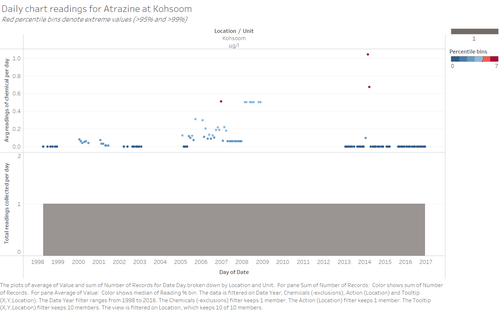
Erratic spikes in light-concentration chemicals
Erratic spikes were also noted in readings for other chemicals, however due to data deficiencies such as sparsity, it is difficult to determine whether these abnormalities had sustained increases after. In addition, these chemicals are light in concentration - indicative from their values being very low to begin with and also measured in µg/l. They are featured simply by merit of their spikes as well as the location of occurrence coinciding with Kohsoom.
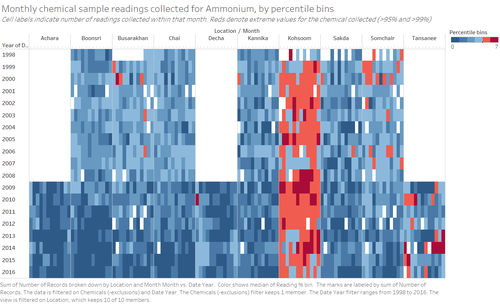
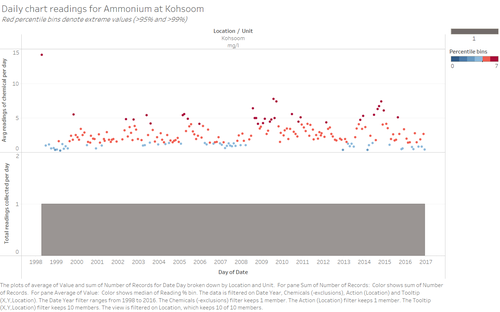
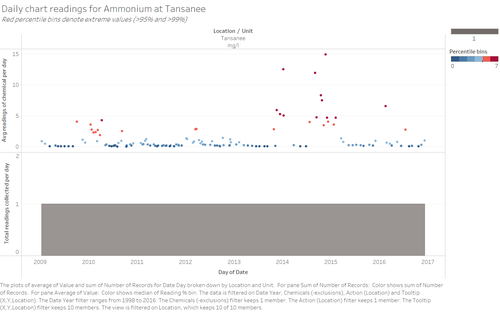
Consistently high concentration of Ammonium
Another anomaly which particularly interesting to note was the consistent high concentration of Ammonium in Kohsoom over every year. The visual heatmap highlights this immediately at first glance:
While Tansanee data started only from 2009, outliers hint at Tansanee showing more extreme values in recent years. From the location-specific charts, we clearly see the consistently higher readings at Kohsoom while values Tansanee start registering greater extremes from 2013.
Findings 4 - Methylosmoline
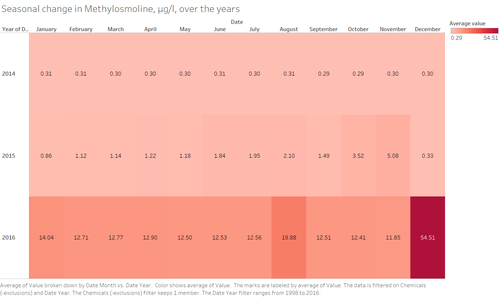
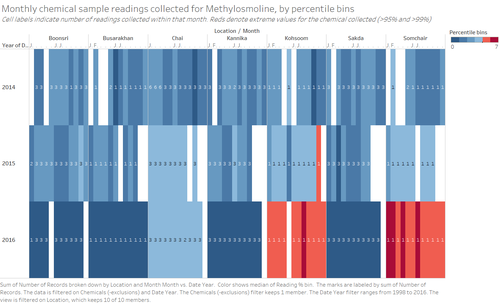
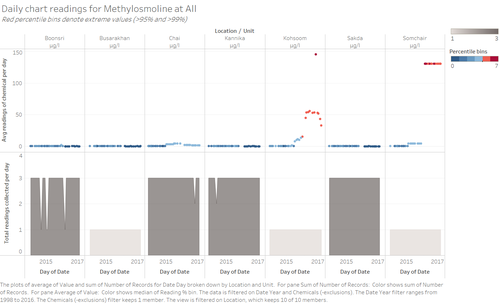
With the contexts of Finding 2, it is still possible to deep-dive into the data on Methylosmoline readings to uncover further insights. To start off, the seasonal view for Methylosmoline is explored, followed by a review on the monthly readings.
From the charts, there are no seasonal changes within each year in Methylosmoline. However there is a significant increase in its quantities in the soil in 2016, especially December, which reflects an extreme increase in readings. From the location breakdown, the disparity between the readings and the outliers are quite pronounced, and it is also clear that all the outliers are fall into the 2 locations - Kohsoom and Somchair.
Findings 5 - Other abnormalities of interest
A few remaining chemicals have been noted with various atypical patterns in readings. These have been grouped together and presented below.
- Magnesium
the year 2011 shows
- Chlorides mg consistent high at Tansanee, spikes at Sakda - lack of previous readings for comparison
- Orthophosphate-phosphorus mg - small, kohsoom, boonsri, achara
- AGOC-3A Boonsri
