Difference between revisions of "Is this company growing(2015-2017)"
| (4 intermediate revisions by the same user not shown) | |||
| Line 38: | Line 38: | ||
<th>Insight</th> | <th>Insight</th> | ||
</tr> | </tr> | ||
| − | + | ||
| − | |||
| − | |||
| − | |||
| − | |||
| − | |||
| − | |||
| − | |||
| − | |||
| − | |||
| − | |||
| − | |||
| − | |||
| − | |||
| − | |||
| − | |||
| − | |||
| − | |||
| − | |||
| − | |||
| − | |||
<tr> | <tr> | ||
| − | |||
| − | |||
| − | + | <td> | |
| − | |||
| − | |||
| − | |||
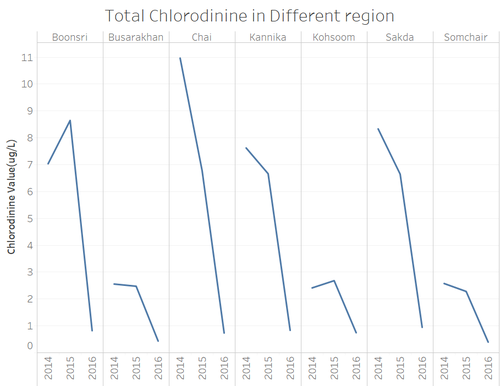
Chloridinine [https://public.tableau.com/views/heatmap_73/Chlorodinine?:embed=y&:display_count=yes&publish=yes]: | Chloridinine [https://public.tableau.com/views/heatmap_73/Chlorodinine?:embed=y&:display_count=yes&publish=yes]: | ||
[[File:C.png|500px|center]] | [[File:C.png|500px|center]] | ||
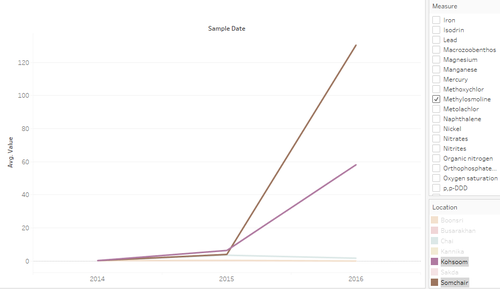
Methylosmoline [https://public.tableau.com/views/heatmap_73/Methylosmoline?:embed=y&:display_count=yes&publish=yes]: | Methylosmoline [https://public.tableau.com/views/heatmap_73/Methylosmoline?:embed=y&:display_count=yes&publish=yes]: | ||
| − | [[File:M.png|500px|center]]</td> | + | [[File:M.png|500px|center]] |
| − | </ | + | </td> |
| + | |||
| + | <td> | ||
| + | <b> Is this company growing(2015-2017) </b> | ||
| + | <br> | ||
| + | |||
| − | |||
| − | |||
| − | |||
| − | + | In terms of Meeting, Purchase, Call, Email record from May 2015 to December 2017, four graphs below indicate the trend of the number of records separately. | |
| + | From Purchase, Call and Email record perspectives, starting in May 2015, the number of records increased rapidly in the next two months (July 2017). After this, the number of records of the three aspects almost keep dynamically stable trends. | ||
| + | From the meeting records, the number has kept a growth trend since October 2015. Before this, the number of meeting almost is 0. | ||
| + | In a sum, the company grows rapidly from May 2015 to July 2015. After this, in general, the company keeps a dynamically stable trend in the communications and purchase records. | ||
| − | |||
</td> | </td> | ||
| − | + | ||
| − | |||
| − | |||
| − | |||
| − | |||
</tr> | </tr> | ||
| + | |||
| + | |||
</table> | </table> | ||
Latest revision as of 18:13, 8 July 2018
|
|
|
|
|
Viz & Insights
Deep Exploration
| Figure | Insight |
|---|---|
|
Chloridinine [1]: Methylosmoline [2]: |
Is this company growing(2015-2017)
In terms of Meeting, Purchase, Call, Email record from May 2015 to December 2017, four graphs below indicate the trend of the number of records separately. From Purchase, Call and Email record perspectives, starting in May 2015, the number of records increased rapidly in the next two months (July 2017). After this, the number of records of the three aspects almost keep dynamically stable trends. From the meeting records, the number has kept a growth trend since October 2015. Before this, the number of meeting almost is 0. In a sum, the company grows rapidly from May 2015 to July 2015. After this, in general, the company keeps a dynamically stable trend in the communications and purchase records. |


