Difference between revisions of "Q1"
(Created page with "<font size="5"><font color="#8B4513">'''Viz & Insights'''</font></font> ==Deep Exploration== <table> <table border='1'> <tr> <th>Description</th> <th>Illustration</th> </tr>...") |
(No difference)
|
Revision as of 17:50, 8 July 2018
Viz & Insights
Deep Exploration
| Description | Illustration |
|---|---|
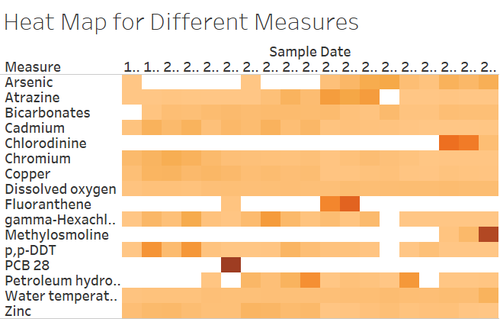
| 1.Heat map
|
Heat map [1]: |
| 2.Changing with the location?
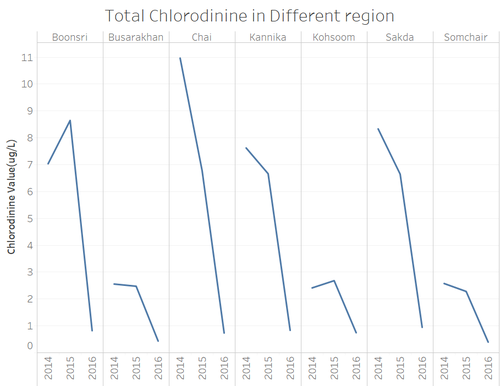
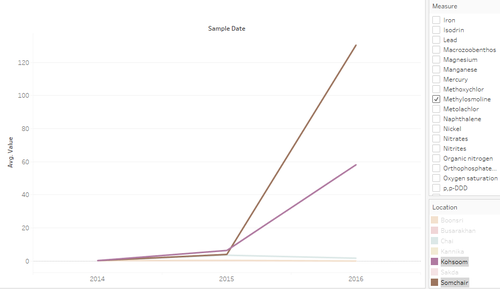
For Chloridinines:In Chai, it drop steeply and in Kannika and Sakda, it drop slowly then drop steeply, and in Busarakhan and Somchair, it’s more or less the same trend, and in Boonsri and Kohsoom, 2014 value is higher lower than 2015, then both drop sharply. They both reached the low point in 2016. For Methylosmoline:In Boonsri, Busarakhan, Kannika and Sakda, the value is very small, but in Chai, 2015, the value is higher, and for Kohsoom and Somchair , it sharply increased in 2016. |
Chloridinine [2]: Methylosmoline [3]: |
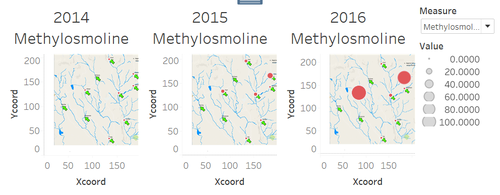
| 3.Geo map
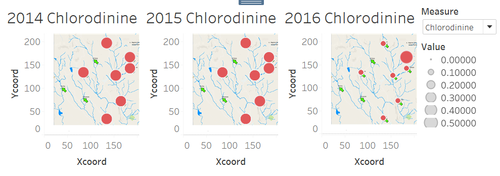
For Chloridinine, as we can see, we don’t have recorded data in Achara, Decha and Tansanee. In other places, we can see that in 2014 and 2015, Chlorodinine is relatively evenly distributed in all the places, but in 2016, only Kohsoom increased, the other places all declined. For Methylosmoline, Methylosmoline only sharply increased in Kohsoom and Somchair from 2014 to 2016. |
Chloridinine [4]: Methylosmoline [5]: |
