Difference between revisions of "ISSS608 2017-18 T3 Assign Priyadarsan Shankar Visualization"
| (One intermediate revision by the same user not shown) | |||
| Line 34: | Line 34: | ||
__TOC__ | __TOC__ | ||
| − | ==<font size = 5; color="#8B4513" face="Segoe UI | + | ==<font size = 5; color="#8B4513" face="Segoe UI Light">Past vs Present characterization</font>== |
| − | <font size = 2; color="#000000" face="Segoe UI | + | <font size = 2; color="#000000" face="Segoe UI Semibold">The findings aligned to Q1 of the VAST Mini Challenge 2 - 2018, related to a past and recent present characterization with respect to the chemical contamination across the Boonsong Legakul water ways are below:</font> |
| − | ===<font size = 3; color="#8B4513" face="Segoe UI | + | ===<font size = 3; color="#8B4513" face="Segoe UI Light">Methylosmolene</font>=== |
| − | <font size = 2; color="#000000" face="Segoe UI | + | <font size = 2; color="#000000" face="Segoe UI Semibold">This solvent is deemed as the most harmful VOC (Volatile Organic Compound) being released by the furniture factories and being dumped in the chemical waste dumping ground and causing harm to the pipit and other wildlife. |
It has seen a never seen before sudden spike at Kohsoom in august 2016 to 145µg/l and dropped. Somchair has also seen a sudden spike in 2016 and the value has been constantly at a record high at 130.5µg/l from February to December 2016. Kohsoom being close by the known dumping site could’ve had a dumping in august cause the spike and there’s a possible second dumping site in the vicinity of Somchair.</font> | It has seen a never seen before sudden spike at Kohsoom in august 2016 to 145µg/l and dropped. Somchair has also seen a sudden spike in 2016 and the value has been constantly at a record high at 130.5µg/l from February to December 2016. Kohsoom being close by the known dumping site could’ve had a dumping in august cause the spike and there’s a possible second dumping site in the vicinity of Somchair.</font> | ||
| − | + | [[File:pd_i_methylo.png|900px|center]] | |
| − | ===<font size = 3; color="#8B4513" face="Segoe UI | + | ===<font size = 3; color="#8B4513" face="Segoe UI Light">Chlorodinine</font>=== |
| − | <font size = 2; color="#000000" face="Segoe UI | + | <font size = 2; color="#000000" face="Segoe UI Semibold">The other harmful chemical as investigated before is Chlorodinine, the levels of this chemical have been dropping in 2016 consistently but Kohsoom alone has seen a never before spike in around the same time frame as the Methylosmolene spike.</font> |
| − | + | [[File:pd_i_chloro.png|900px|center]] | |
| − | ===<font size = 3; color="#8B4513" face="Segoe UI | + | ===<font size = 3; color="#8B4513" face="Segoe UI Light">Manganese</font>=== |
| − | <font size = 2; color="#000000" face="Segoe UI | + | <font size = 2; color="#000000" face="Segoe UI Semibold">Manganese levels spike to year high increasing around 300 times exactly on the 15th of August each year every year, and then drop to the usual levels close to 0. This spike is a recurring trend every year and stops at 2003. The values are at the normal low levels since.</font> |
| − | + | [[File:pd_i_manganese.png|900px|center]] | |
| − | ===<font size = 3; color="#8B4513" face="Segoe UI | + | ===<font size = 3; color="#8B4513" face="Segoe UI Light">Dissolved oxygen</font>=== |
| − | <font size = 2; color="#000000" face="Segoe UI | + | <font size = 2; color="#000000" face="Segoe UI Semibold">The dissolved oxygen levels follow a yearly seasonal trend rising and falling in the winter and summer months respectively. This being a vital constituent for life in the water, the falls below the control levels for aquatic life to survive are dangerous along with the contamination.</font> |
| − | + | [[File:pd_i_disoxy.png|900px|center]] | |
| − | ===<font size = 3; color="#8B4513" face="Segoe UI | + | ===<font size = 3; color="#8B4513" face="Segoe UI Light">Nitrates</font>=== |
| − | <font size = 2; color="#000000" face="Segoe UI | + | <font size = 2; color="#000000" face="Segoe UI Semibold">The nitrates which is another harmful component for bird life is higher in the colder months of fall and winter and comparatively lower in Spring and summer which is a repeating trend across years.</font> |
| − | + | [[File:pd_i_nitrate.png|900px|center]] | |
| − | ===<font size = 3; color="#8B4513" face="Segoe UI | + | ===<font size = 3; color="#8B4513" face="Segoe UI Light">Sulphates</font>=== |
| − | <font size = 2; color="#000000" face="Segoe UI | + | <font size = 2; color="#000000" face="Segoe UI Semibold">Sulphates had a increasing trend in the starting years of 1998-2002, then had a decreasing trend till 2011, a sudden spike after followed by a continuing increasing trend which is a point to be investigated. The pattern is similar across Busarakhan nearby the known dumping site and Somchair where a suspected illegal dumping site is located.</font> |
| − | + | [[File:pd_i_sulphate1.png|900px|center]] | |
| − | + | [[File:pd_i_sulphate2.png|900px|center]] | |
| − | ==<font size = 5; color="#8B4513" face="Segoe UI | + | ==<font size = 5; color="#8B4513" face="Segoe UI Light">Sampling anomalies</font>== |
| − | <font size = 2; color="#000000" face="Segoe UI | + | <font size = 2; color="#000000" face="Segoe UI Semibold">The findings aligned to Q2 of the VAST Mini Challenge 2 - 2018, related to finding anomalies in the sampling of measurements of the measures across the Boonsong Legakul water ways are below:</font> |
| − | ===<font size = 3; color="#8B4513" face="Segoe UI | + | ===<font size = 3; color="#8B4513" face="Segoe UI Light">Six years silence</font>=== |
| − | <font size = 2; color="#000000" face="Segoe UI | + | <font size = 2; color="#000000" face="Segoe UI Semibold">Selecting the most critical contaminants that cause harm to bird life from water in their environment Methylosmolene, Chlorodinine, AGOC-3A, Lead, Copper, Iron, Nickel, Mercury, Copper, Arsenic, Zinc, Total hardness viewing their sampling reveals some interesting anomalies. |
<br><br>There is a window of 6 years, from 1999-2004 where half of these measures especially Arsenic, Methylosmole, Chlorodinine, Cyanides, Total hardness, Zinc have not been measured at all across all the locations in the preserve. | <br><br>There is a window of 6 years, from 1999-2004 where half of these measures especially Arsenic, Methylosmole, Chlorodinine, Cyanides, Total hardness, Zinc have not been measured at all across all the locations in the preserve. | ||
</font> | </font> | ||
| − | + | [[File:pd_i_6year.png|900px|center]] | |
| − | ===<font size = 3; color="#8B4513" face="Segoe UI | + | ===<font size = 3; color="#8B4513" face="Segoe UI Light">Two year stream gaps</font>=== |
| − | <font size = 2; color="#000000" face="Segoe UI | + | <font size = 2; color="#000000" face="Segoe UI Semibold">There’s a two year window that varies across streams where no measurements are taken of the chemicals of interest and sparse reading of the other measures. This window varies across locations and streams. In Boonsri and Kohsoom the locations close to the dumping site, it’s 2008-09, then it’s Busarakhan, Chai, Kannika, Achara, Somchair and Sakda along the streams 1 and 2 in years 2012-13. Interestingly the gaps co-insides with the factory setup timeline of Kasios inside the preserve. It could be due to construction work ongoing inside the forest hampering the water quality measurement activity. |
</font> | </font> | ||
| − | + | [[File:pd_i_2year.png|900px|center]] | |
| − | ===<font size = 3; color="#8B4513" face="Segoe UI | + | ===<font size = 3; color="#8B4513" face="Segoe UI Light">New stations?</font>=== |
| − | <font size = 2; color="#000000" face="Segoe UI | + | <font size = 2; color="#000000" face="Segoe UI Semibold">Achara on stream 2, Tansanee and Decha on 3 and 4 respectively have no water sensor measurement readings recorded before 2009 when the treaty was signed with Kasios for the preservation of nature inside the Boonsong Legakul preserve. So, there is no past data to analyse any trend or spikes in these locations. |
</font> | </font> | ||
| − | + | [[File:pd_i_newloc.png|900px|center]] | |
| − | ===<font size = 3; color="#8B4513" face="Segoe UI | + | ===<font size = 3; color="#8B4513" face="Segoe UI Light">Samples vs Chemicals</font>=== |
| − | <font size = 2; color="#000000" face="Segoe UI | + | <font size = 2; color="#000000" face="Segoe UI Semibold">In the quadrant analysis of Numbers of samples taken x Number of unique measures measured, the sampling rate and the measures have had an increasing trend across the preserve until 2009 and had the maximums at 2008 and 09 with most locations in or close to the High-High upper right quadrant, since then the numbers are on a decreasing trend falling drastically by year to the Low-Low quadrant lower left. To put things to a perspective, in year 2007, 3045 readings were taken of 55 measures as the maximum which has fallen to 1709 readings of only 30 measures as the yearly maximum in 2016. |
</font> | </font> | ||
| − | + | [[File:pd_i_sampchem.png|900px|center]] | |
| − | ===<font size = 3; color="#8B4513" face="Segoe UI | + | ===<font size = 3; color="#8B4513" face="Segoe UI Light">Days between readings</font>=== |
| − | <font size = 2; color="#000000" face="Segoe UI | + | <font size = 2; color="#000000" face="Segoe UI Semibold">Digging deeper into the haphazard sampling policy of the water sensor readings, with a days between subsequent readings of a measure at a location perspective. We see that there are gaps of more than 500 days between subsequent readings of measures at locations. This hampers any time series analysis techniques to be applied on the data as the readings are very irregularly spaced.<br><br> |
Labelling the readings by measures we can see AOX, Arsenic, Sulphates, Iron, Silica, hardness are the very irregularly measured measures. | Labelling the readings by measures we can see AOX, Arsenic, Sulphates, Iron, Silica, hardness are the very irregularly measured measures. | ||
</font> | </font> | ||
| − | + | [[File:pd_i_daysince.png|900px|center]] | |
| − | <font size = 2; color="#000000" face="Segoe UI | + | <font size = 2; color="#000000" face="Segoe UI Semibold">Labelling the measures by location, we can see the measuring rate is very poor at Tansanee, Boonsri and Kannika for some measure. |
</font> | </font> | ||
| − | + | [[File:pd_i_daysince2.png|900px|center]] | |
| − | ===<font size = 3; color="#8B4513" face="Segoe UI | + | ===<font size = 3; color="#8B4513" face="Segoe UI Light">Samples across seasons</font>=== |
| − | <font size = 2; color="#000000" face="Segoe UI | + | <font size = 2; color="#000000" face="Segoe UI Semibold">The sample count is sparse in the winter weeks compared to the other seasons, this could be because of possible snowing or the water freezing over in the preserve waterways. |
</font> | </font> | ||
| − | + | [[File:pd_i_seasons.png|900px|center]] | |
| − | ==<font size = 5; color="#8B4513" face="Segoe UI | + | ==<font size = 5; color="#8B4513" face="Segoe UI Light">What's killing the Pipits?</font>== |
| − | <font size = 2; color="#000000" face="Segoe UI | + | <font size = 2; color="#000000" face="Segoe UI Semibold">The findings aligned to Q3 of the VAST Mini Challenge 2 - 2018, related to finding possible reasons to suspect contamination causing harm to the Pipit and other wildlife are below:</font> |
| − | ===<font size = 3; color="#8B4513" face="Segoe UI | + | ===<font size = 3; color="#8B4513" face="Segoe UI Light">Contamination across locations</font>=== |
| − | <font size = 2; color="#000000" face="Segoe UI | + | <font size = 2; color="#000000" face="Segoe UI Semibold">Ranking the locations by chemical contamination level of the different chemicals, Kohsoom, Somchair and Tansanee are on top of the contamination charts in the measures measured in mg/l. |
</font> | </font> | ||
| − | + | [[File:pd_i_contheat1.png|900px|center]] | |
| − | <font size = 2; color="#000000" face="Segoe UI | + | <font size = 2; color="#000000" face="Segoe UI Semibold">Kohsoom, Tansanee rank on top of the temperature charts also which could indicate to rise in temperate due to dumping activity in the known dumping site and suspected other illegal dumping site. |
</font> | </font> | ||
| − | + | [[File:pd_i_contheat2.png|900px|center]] | |
| − | ===<font size = 3; color="#8B4513" face="Segoe UI | + | ===<font size = 3; color="#8B4513" face="Segoe UI Light">Water quality index over years</font>=== |
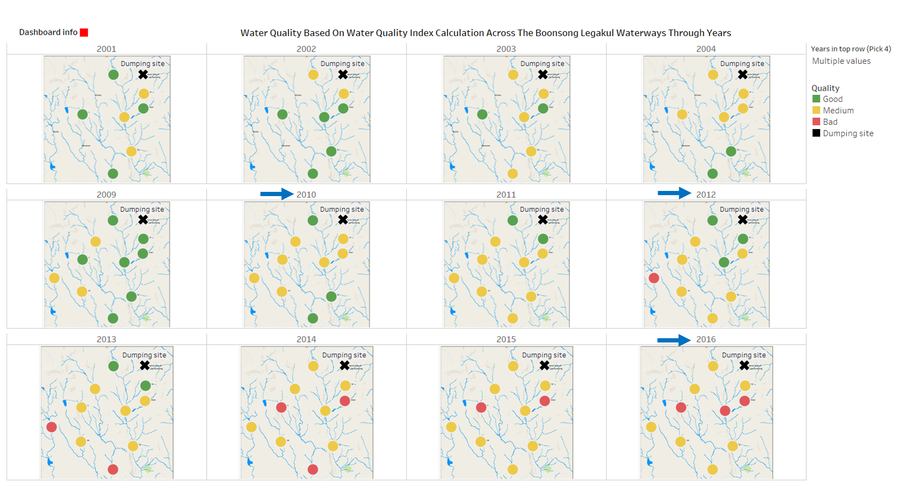
| − | <font size = 2; color="#000000" face="Segoe UI | + | <font size = 2; color="#000000" face="Segoe UI Semibold">Mapping the water quality over years across the locations of measurement, we can see a sudden dip in water quality from 2009 going to 2010 across most locations and the quality keeps falling since then. Decha flags as the first location to hit poor water quality in 2012 and continues to be till 2013, but this cannot be a foolproof conclusion as Decha has a very low sampling rate and is in a stream where there’s only one sensor sensing location so the temperature delta factor is already inaccurate. The other locations however seem to be aligned with our other findings, Somchair flags as POOR from 2014 and Busarakhan and Chai a year after another. |
</font> | </font> | ||
| − | + | [[File:pd_i_wqimap.png|900px|center]] | |
| − | ===<font size = 3; color="#8B4513" face="Segoe UI | + | ===<font size = 3; color="#8B4513" face="Segoe UI Light">Water quality trend</font>=== |
| − | <font size = 2; color="#000000" face="Segoe UI | + | <font size = 2; color="#000000" face="Segoe UI Semibold">The water quality in the preserve is depreciating rapidly, this can be seen by looking at the trend control chart for the location near the dumping site and the suspected illegal dumping site at Busarakhan: |
</font> | </font> | ||
| − | + | [[File:pd_i_wqicontrol1.png|600px|center]] | |
| − | <font size = 2; color="#000000" face="Segoe UI | + | <font size = 2; color="#000000" face="Segoe UI Semibold">Somchair:</font> |
| − | + | [[File:pd_i_wqicontrol2.png|600px|center]] | |
Latest revision as of 17:09, 8 July 2018
VAST Challenge 2018: Suspense at the Wildlife Preserve
Mini Challenge 2 - Like a duck to water
|
|
|
|
|
|
|
Past vs Present characterization
The findings aligned to Q1 of the VAST Mini Challenge 2 - 2018, related to a past and recent present characterization with respect to the chemical contamination across the Boonsong Legakul water ways are below:
Methylosmolene
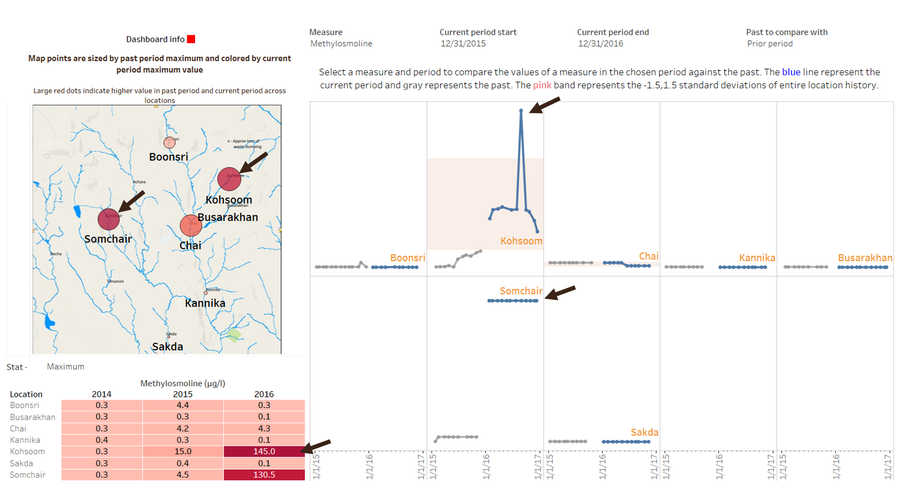
This solvent is deemed as the most harmful VOC (Volatile Organic Compound) being released by the furniture factories and being dumped in the chemical waste dumping ground and causing harm to the pipit and other wildlife. It has seen a never seen before sudden spike at Kohsoom in august 2016 to 145µg/l and dropped. Somchair has also seen a sudden spike in 2016 and the value has been constantly at a record high at 130.5µg/l from February to December 2016. Kohsoom being close by the known dumping site could’ve had a dumping in august cause the spike and there’s a possible second dumping site in the vicinity of Somchair.
Chlorodinine
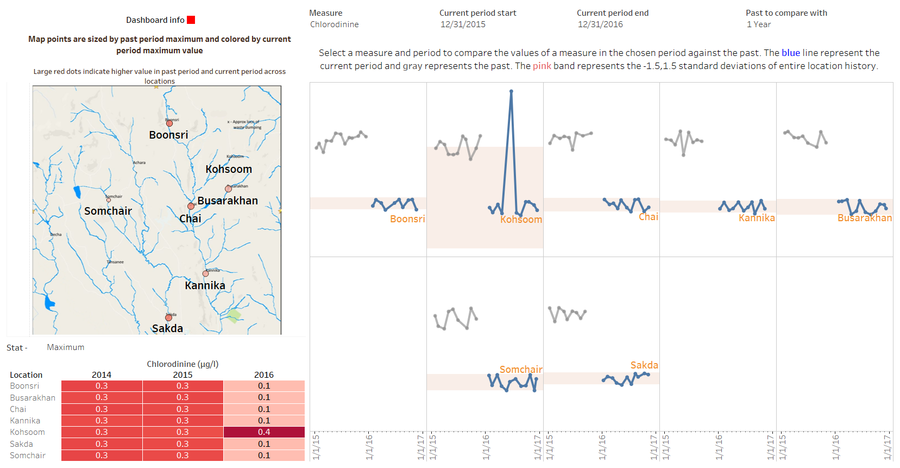
The other harmful chemical as investigated before is Chlorodinine, the levels of this chemical have been dropping in 2016 consistently but Kohsoom alone has seen a never before spike in around the same time frame as the Methylosmolene spike.
Manganese
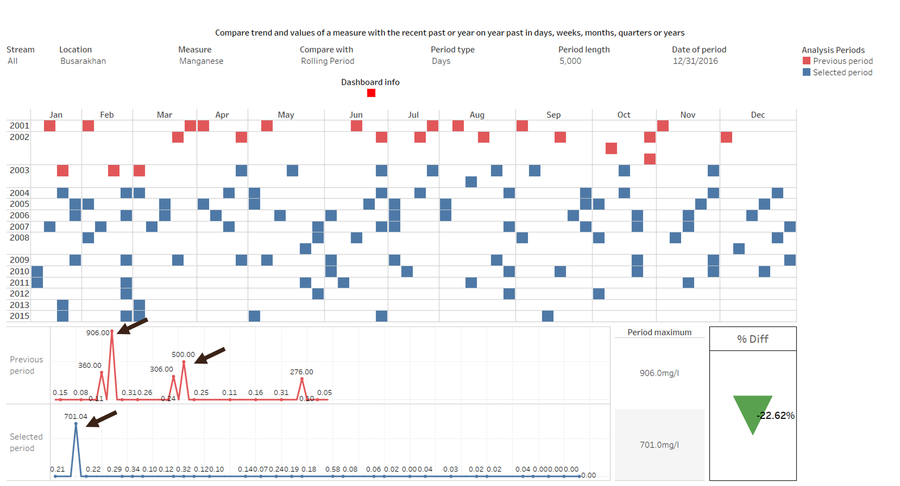
Manganese levels spike to year high increasing around 300 times exactly on the 15th of August each year every year, and then drop to the usual levels close to 0. This spike is a recurring trend every year and stops at 2003. The values are at the normal low levels since.
Dissolved oxygen
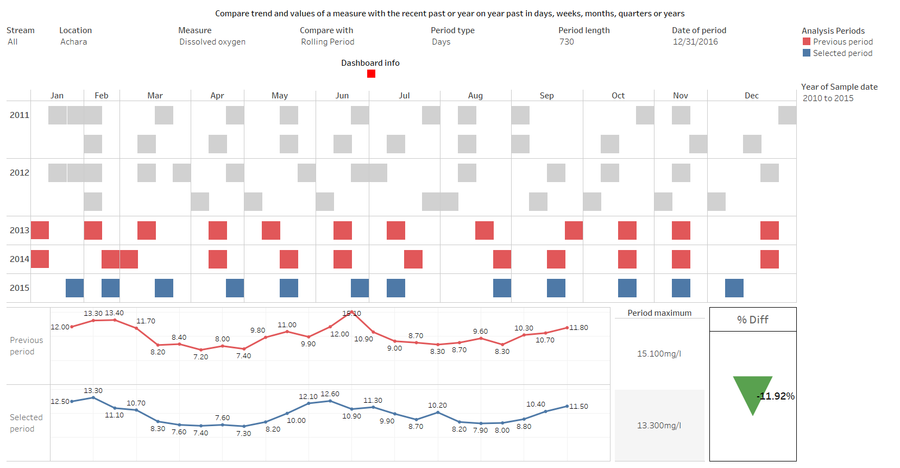
The dissolved oxygen levels follow a yearly seasonal trend rising and falling in the winter and summer months respectively. This being a vital constituent for life in the water, the falls below the control levels for aquatic life to survive are dangerous along with the contamination.
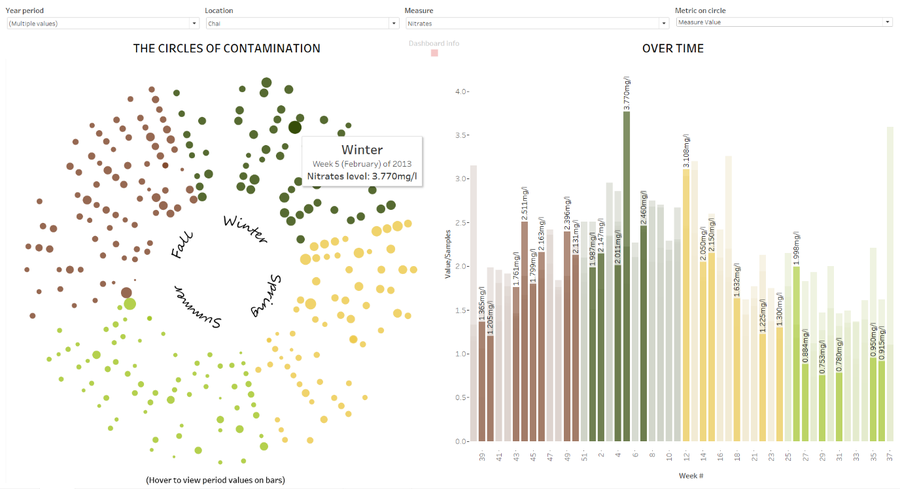
Nitrates
The nitrates which is another harmful component for bird life is higher in the colder months of fall and winter and comparatively lower in Spring and summer which is a repeating trend across years.
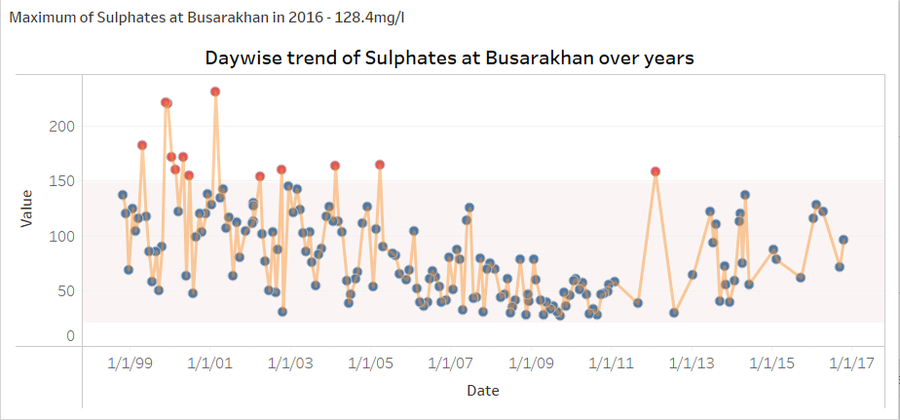
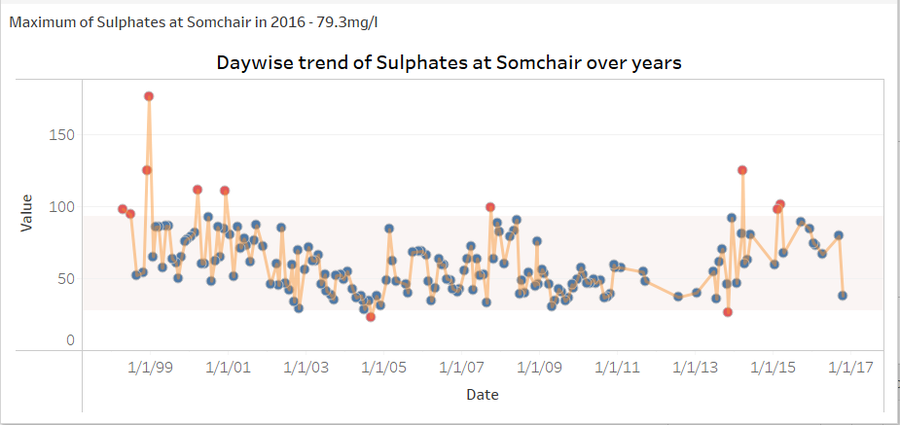
Sulphates
Sulphates had a increasing trend in the starting years of 1998-2002, then had a decreasing trend till 2011, a sudden spike after followed by a continuing increasing trend which is a point to be investigated. The pattern is similar across Busarakhan nearby the known dumping site and Somchair where a suspected illegal dumping site is located.
Sampling anomalies
The findings aligned to Q2 of the VAST Mini Challenge 2 - 2018, related to finding anomalies in the sampling of measurements of the measures across the Boonsong Legakul water ways are below:
Six years silence
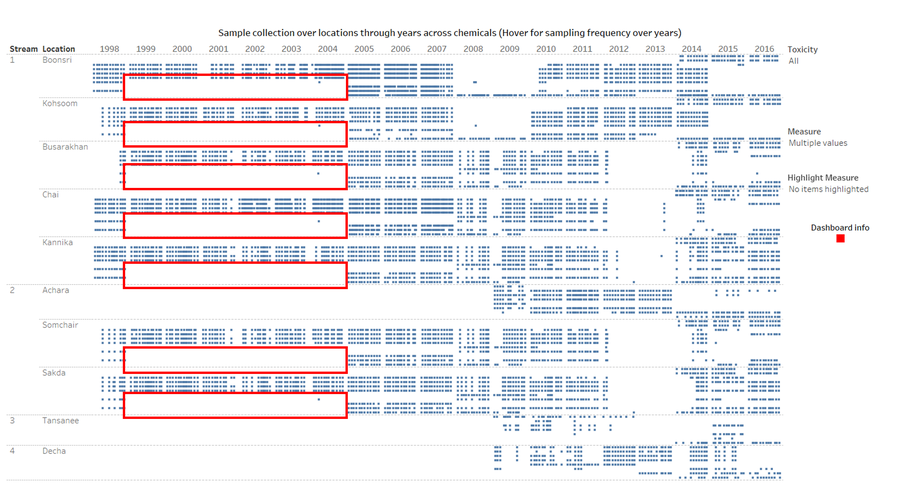
Selecting the most critical contaminants that cause harm to bird life from water in their environment Methylosmolene, Chlorodinine, AGOC-3A, Lead, Copper, Iron, Nickel, Mercury, Copper, Arsenic, Zinc, Total hardness viewing their sampling reveals some interesting anomalies.
There is a window of 6 years, from 1999-2004 where half of these measures especially Arsenic, Methylosmole, Chlorodinine, Cyanides, Total hardness, Zinc have not been measured at all across all the locations in the preserve.
Two year stream gaps
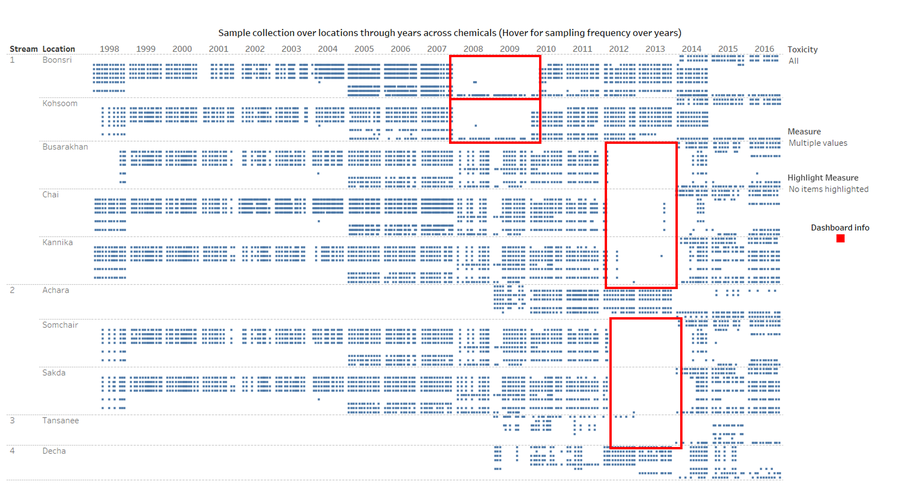
There’s a two year window that varies across streams where no measurements are taken of the chemicals of interest and sparse reading of the other measures. This window varies across locations and streams. In Boonsri and Kohsoom the locations close to the dumping site, it’s 2008-09, then it’s Busarakhan, Chai, Kannika, Achara, Somchair and Sakda along the streams 1 and 2 in years 2012-13. Interestingly the gaps co-insides with the factory setup timeline of Kasios inside the preserve. It could be due to construction work ongoing inside the forest hampering the water quality measurement activity.
New stations?
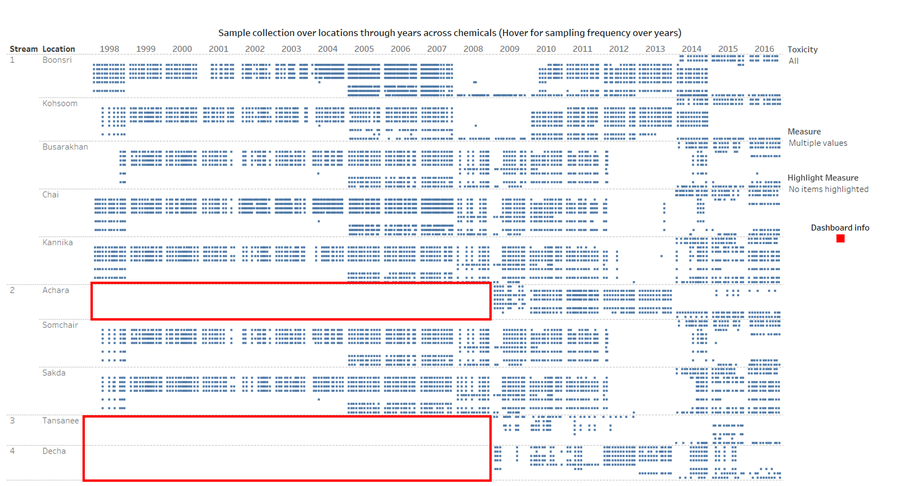
Achara on stream 2, Tansanee and Decha on 3 and 4 respectively have no water sensor measurement readings recorded before 2009 when the treaty was signed with Kasios for the preservation of nature inside the Boonsong Legakul preserve. So, there is no past data to analyse any trend or spikes in these locations.
Samples vs Chemicals
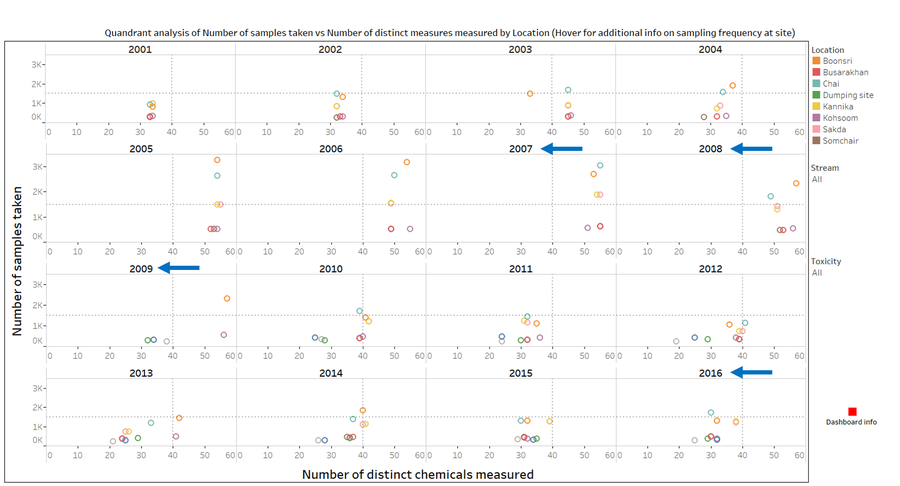
In the quadrant analysis of Numbers of samples taken x Number of unique measures measured, the sampling rate and the measures have had an increasing trend across the preserve until 2009 and had the maximums at 2008 and 09 with most locations in or close to the High-High upper right quadrant, since then the numbers are on a decreasing trend falling drastically by year to the Low-Low quadrant lower left. To put things to a perspective, in year 2007, 3045 readings were taken of 55 measures as the maximum which has fallen to 1709 readings of only 30 measures as the yearly maximum in 2016.
Days between readings
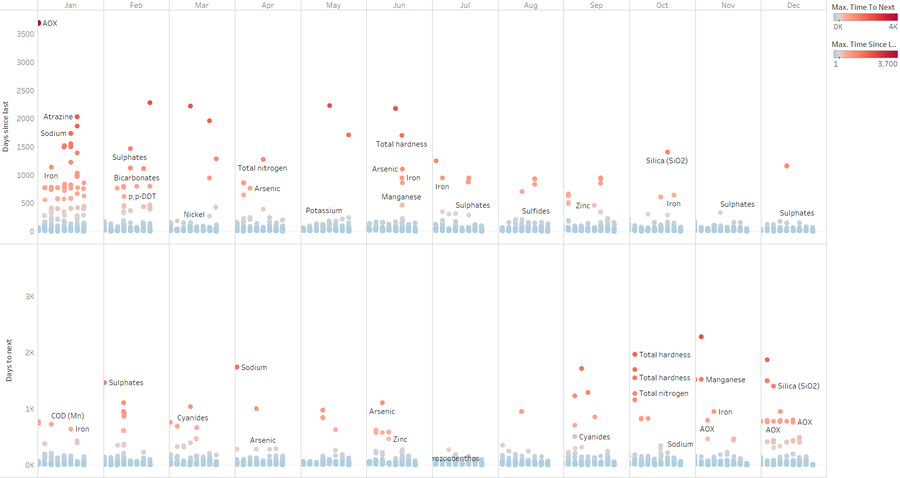
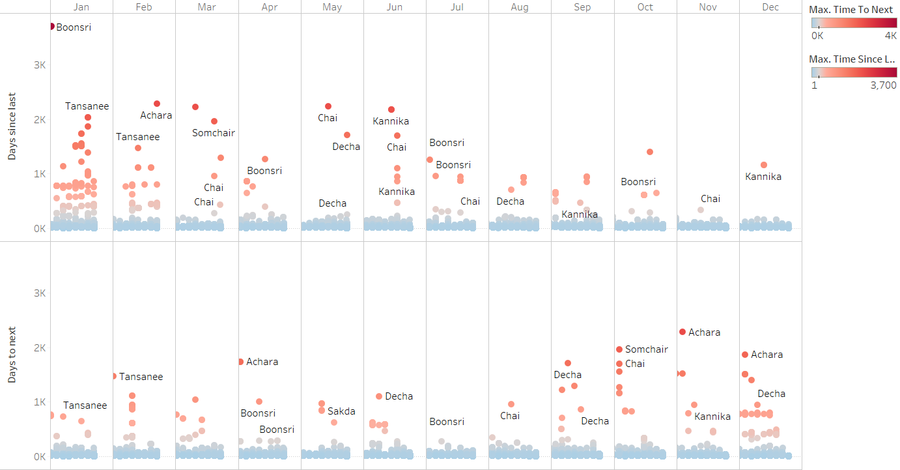
Digging deeper into the haphazard sampling policy of the water sensor readings, with a days between subsequent readings of a measure at a location perspective. We see that there are gaps of more than 500 days between subsequent readings of measures at locations. This hampers any time series analysis techniques to be applied on the data as the readings are very irregularly spaced.
Labelling the readings by measures we can see AOX, Arsenic, Sulphates, Iron, Silica, hardness are the very irregularly measured measures.
Labelling the measures by location, we can see the measuring rate is very poor at Tansanee, Boonsri and Kannika for some measure.
Samples across seasons
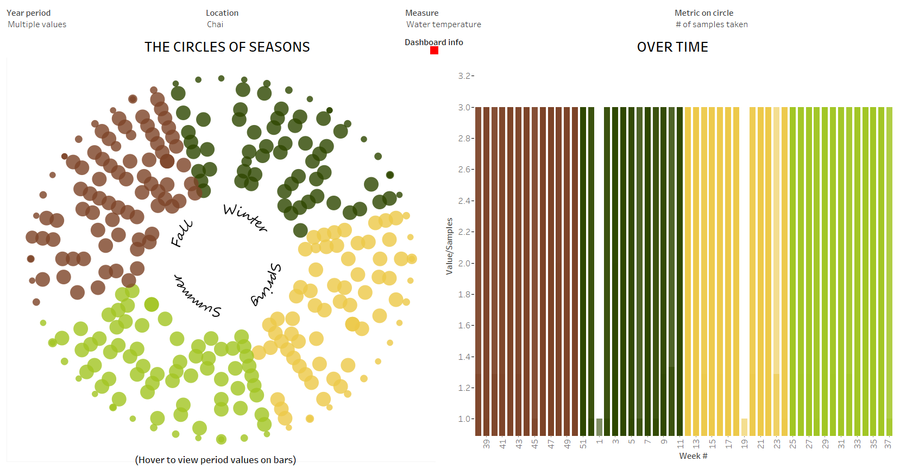
The sample count is sparse in the winter weeks compared to the other seasons, this could be because of possible snowing or the water freezing over in the preserve waterways.
What's killing the Pipits?
The findings aligned to Q3 of the VAST Mini Challenge 2 - 2018, related to finding possible reasons to suspect contamination causing harm to the Pipit and other wildlife are below:
Contamination across locations
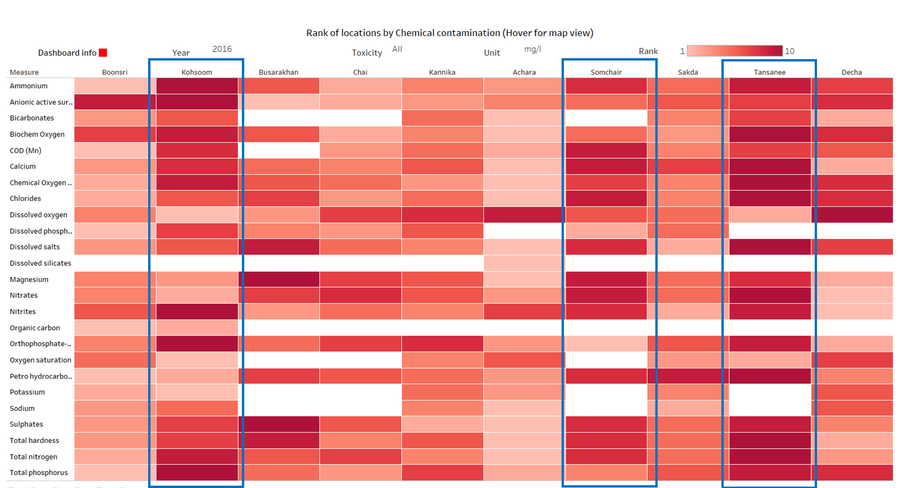
Ranking the locations by chemical contamination level of the different chemicals, Kohsoom, Somchair and Tansanee are on top of the contamination charts in the measures measured in mg/l.
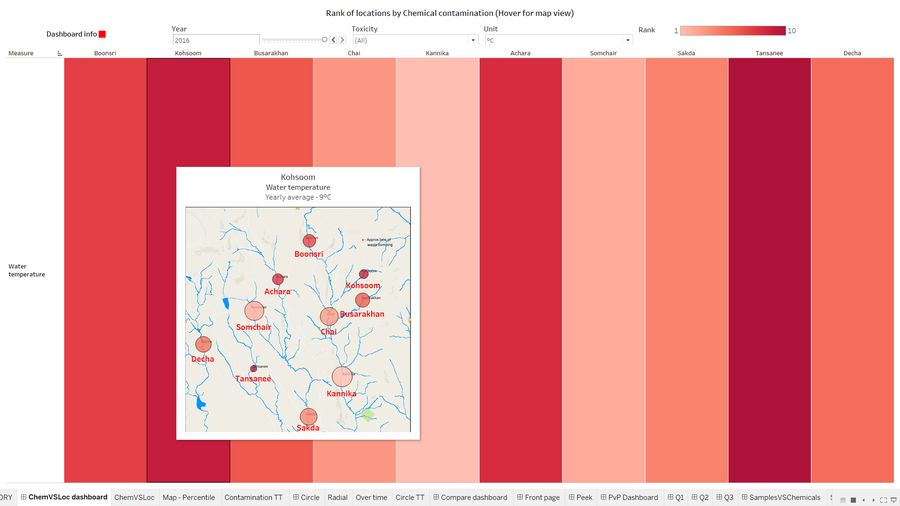
Kohsoom, Tansanee rank on top of the temperature charts also which could indicate to rise in temperate due to dumping activity in the known dumping site and suspected other illegal dumping site.
Water quality index over years
Mapping the water quality over years across the locations of measurement, we can see a sudden dip in water quality from 2009 going to 2010 across most locations and the quality keeps falling since then. Decha flags as the first location to hit poor water quality in 2012 and continues to be till 2013, but this cannot be a foolproof conclusion as Decha has a very low sampling rate and is in a stream where there’s only one sensor sensing location so the temperature delta factor is already inaccurate. The other locations however seem to be aligned with our other findings, Somchair flags as POOR from 2014 and Busarakhan and Chai a year after another.
Water quality trend
The water quality in the preserve is depreciating rapidly, this can be seen by looking at the trend control chart for the location near the dumping site and the suspected illegal dumping site at Busarakhan:
Somchair:
