Difference between revisions of "ISSS608 2017-18 T3 Assign Lim Wee Kiong Data Preparation"
Wklim.2017 (talk | contribs) |
Wklim.2017 (talk | contribs) |
||
| (5 intermediate revisions by the same user not shown) | |||
| Line 33: | Line 33: | ||
| − | |||
| − | + | =Understanding the Raw Data – Samples Readings and Measures= | |
The data given to us comes in 2 main files: Boonsong Lekagul waterways readings.csv and chemical units of measure.csv. | The data given to us comes in 2 main files: Boonsong Lekagul waterways readings.csv and chemical units of measure.csv. | ||
| Line 78: | Line 77: | ||
| − | + | =Deriving Auxiliary Data – The Map= | |
Another data given to us is the Waterways Final.jpg, which is a low-res map of the preserve and it shows the location of the various sampling points. I believed there is value in knowing the exact coordinates of each point and hence I have created a tableau version of the map. | Another data given to us is the Waterways Final.jpg, which is a low-res map of the preserve and it shows the location of the various sampling points. I believed there is value in knowing the exact coordinates of each point and hence I have created a tableau version of the map. | ||
| Line 159: | Line 158: | ||
This map is important as it will be used as part of the auxiliary data for our analysis, as we try to determine whether water flow contributes to the readings. | This map is important as it will be used as part of the auxiliary data for our analysis, as we try to determine whether water flow contributes to the readings. | ||
| − | + | =Obtaining Knowledge on Hydrology= | |
While this is not a requirement, but it seems useful to learn more about hydrology and water pollution as we embarked on this task. | While this is not a requirement, but it seems useful to learn more about hydrology and water pollution as we embarked on this task. | ||
| Line 167: | Line 166: | ||
[[Image:LWKdataprep5.jpg|center|800px]] | [[Image:LWKdataprep5.jpg|center|800px]] | ||
| − | + | ==Leading Water Contaminants and Measures== | |
By looking at the leading contaminants, I can focus my attention on them as the measures given are extensive and it is not useful to look at all of them. | By looking at the leading contaminants, I can focus my attention on them as the measures given are extensive and it is not useful to look at all of them. | ||
| Line 176: | Line 175: | ||
|width="50%"|<!-- Categories--> <b>Heavy Metals and Industrial Deposits</b>: metals are easily washed into streams and groundwater. Copper and mercury are also found in fungicides. These heavy metals are toxic to biological life including the people who may have to drink from the polluted rivers. Crops that have been irrigated with polluted water can also be dangerous. Heavy metals can also build up in the body causing symptoms of poisoning. | |width="50%"|<!-- Categories--> <b>Heavy Metals and Industrial Deposits</b>: metals are easily washed into streams and groundwater. Copper and mercury are also found in fungicides. These heavy metals are toxic to biological life including the people who may have to drink from the polluted rivers. Crops that have been irrigated with polluted water can also be dangerous. Heavy metals can also build up in the body causing symptoms of poisoning. | ||
|width="10%"|<!-- Measures in the Category--> Aluminium; Arsenic; Barium; Copper; Lead; Mercury; Selenium; Silver; Zinc | |width="10%"|<!-- Measures in the Category--> Aluminium; Arsenic; Barium; Copper; Lead; Mercury; Selenium; Silver; Zinc | ||
| + | |- | ||
| + | |width="50%"|<!-- Categories--> <b>Chlorine and Detergents</b>: Paper and pulp mills use up large amounts of water and produce a lot of polluted wastewater. The wastewater contains strong chemicals such as chlorine, which is used to make paper white and soft. Textile factories also release strong chemicals like caustic soda, acids, dyes and detergents into water. These strong poisons also cause bird and fish kills | ||
| + | |width="10%"|<!-- Measures in the Category--> Chlorine; Chloramine; Chromium | ||
| + | |- | ||
| + | |width="50%"|<!-- Categories--> <b>Fertilisers and Nitrates</b>: Some chemicals like fertilisers are made of substances that do occur naturally in the environment, but only in small amounts. Phosphates and nitrates are found in fertilisers, sewage and soaps. The normal low phosphate level in water inhibits the growth of plants but a small increase of phosphates can result in a rapid increase in plant growth such as blue-green algae and water hyacinth, especially in dams. The water plants become overcrowded and die. When they die, the decomposing bacteria uses up more oxygen and affects other forms of life badly, e.g. fish suffocate. This process is eutrophication. | ||
| + | Nitrogen in the form of ammonia and nitrates form part of the plant nutrients that can lead to eutrophication. Nitrogen normally occurs in a form that plants cannot use (i.e. nitrogen gas), however, it may be used in the decomposition of dead water plants and by blue-green algae which can convert nitrogen in the air into ammonia and nitrates that plants can use. | ||
| + | |width="10%"|<!-- Measures in the Category--> Ammonia; Nitrates; Nitrites; Total Dissolved Phosphorus; Total Phosphorus | ||
| + | |- | ||
| + | |width="50%"|<!-- Categories--> <b>Bacteria and Virus in Water:</b> Some of the more dangerous microbial contaminants, such as E. coli, Giardia, and Cryptosporidium, can cause gastrointestinal problems and flu-like symptoms commonly attributed to undercooked or improperly stored food. | ||
| + | |width="10%"|<!-- Measures in the Category--> Total Coliforms; Fecal Coliforms | ||
| + | |- | ||
| + | |width="50%"|<!-- Categories--> <b>Salt in Water</b>: When you consume too much sodium, the body holds extra water. The kidneys which filter out waste from the blood, maintain a special ratio of electrolytes, such as sodium to potassium, to water. More salt in the diet means the kidneys keep more water in the system. That can have lots of undesirable effects, such as edema (swelling in places like the hands, arms, feet, ankles, and legs); more fluid in general means more blood coursing through veins and arteries. Over time, that causes them to stiffen, which could lead to high blood pressure | ||
| + | |width="10%"|<!-- Measures in the Category--> Total Dissolved Salts (at most 600mg/l) | ||
|- | |- | ||
|} | |} | ||
| + | |||
| + | The above table will form the basis in which data filtering will be done as we focus more on these measures than the rest, due to their undesirable impacts to life. | ||
| + | |||
| + | ==References== | ||
| + | |||
| + | The references for the above-mentioned information came from: | ||
| + | |||
| + | https://www.wqa.org/learn-about-water/common-contaminants | ||
| + | |||
| + | https://www.conserve-energy-future.com/sources-and-causes-of-water-pollution.php | ||
| + | |||
| + | http://www.waterwise.co.za/site/water/environment/substances.html | ||
| + | |||
Back to Dropbox Page | Back to Dropbox Page | ||
[[File:Go back.png|40px|frameless|left|link=Assignment_Dropbox_G1]] | [[File:Go back.png|40px|frameless|left|link=Assignment_Dropbox_G1]] | ||
Latest revision as of 16:16, 8 July 2018
|
|
|
|
|
|
|
Contents
Understanding the Raw Data – Samples Readings and Measures
The data given to us comes in 2 main files: Boonsong Lekagul waterways readings.csv and chemical units of measure.csv.
Data cleaning is done in Excel and data visualization in Tableau.
Descriptions of the data fields for Boonsong Lekagul waterways readings are as follow:
| Field | Description |
|---|---|
| ID | Identification number for the record (only for bookkeeping) |
| Value | Measured value for the chemical or property in this record |
| Location | Name of the location sample was taken from. See the map for geo-location of the sampling site. |
| Sample Date | Date sample was taken from the location |
| Measure | Chemicals (e.g., Sodium) or water properties (e.g., Water temperature) measured in the record |
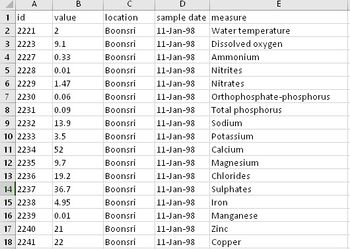
A sample of the data is shown here:
There are a total of 136,825 sample data points across 104 different measures.
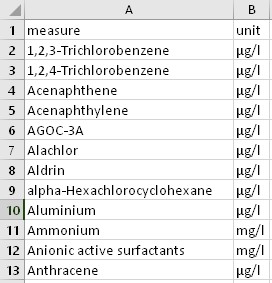
The chemical units of measure csv file is basically the measures with an additional field for the units of measurement. The sample data is as shown below:
At this moment, there does not seem to be any need to clean the data as it looks usable. However, an initial scan of the csv file shows that there could potentially be missing data for several, if not all the measures.
Deriving Auxiliary Data – The Map
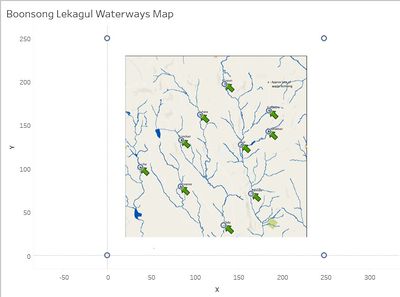
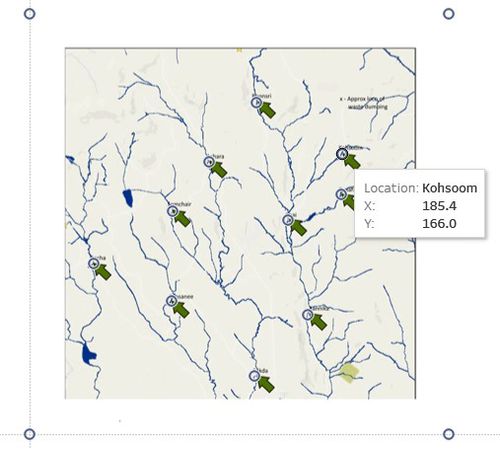
Another data given to us is the Waterways Final.jpg, which is a low-res map of the preserve and it shows the location of the various sampling points. I believed there is value in knowing the exact coordinates of each point and hence I have created a tableau version of the map.
Step 1: A new location.csv is created with the coordinates of the preserve locations and the 4 corners of the map:
| Region | X | Y |
|---|---|---|
| UL | 0 | 249 |
| LL | 0 | 0 |
| UR | 249 | 249 |
| LR | 249 | 0 |
| Achara | 106.5 | 161.18 |
| Boonsri | 134.88 | 196.48 |
| Busarakhan | 184.7 | 141.8 |
| Chai | 153.6 | 126.6 |
| Decha | 38 | 101 |
| Kannika | 165.3 | 70.6 |
| Kohsoom | 185.4 | 166 |
| Sakda | 133.5 | 34.6 |
| Somchair | 85.1 | 132.1 |
| Tansanee | 84.4 | 78.9 |
Step 2: Location.csv is loaded into Tableau and X is plotted to [Columns] and Y to [Rows]. Location is mapped to [Details].
Step 3: The Waterways jpg is loaded via [Map] > [Background Images] > [Add Images] > [Waterways Final] to obtain the final output.
The points are annotated as well so that when the cursor is at each location, we can see the exact coordinates of each station:
This map is important as it will be used as part of the auxiliary data for our analysis, as we try to determine whether water flow contributes to the readings.
Obtaining Knowledge on Hydrology
While this is not a requirement, but it seems useful to learn more about hydrology and water pollution as we embarked on this task.
We have established earlier that Methylosmolene is the main toxic compound in question. But what other chemicals or measures would be useful in knowing its impact to the fauna in the preserve, especially the birds?
Leading Water Contaminants and Measures
By looking at the leading contaminants, I can focus my attention on them as the measures given are extensive and it is not useful to look at all of them.
| Categories | Measures in the Category |
|---|---|
| Heavy Metals and Industrial Deposits: metals are easily washed into streams and groundwater. Copper and mercury are also found in fungicides. These heavy metals are toxic to biological life including the people who may have to drink from the polluted rivers. Crops that have been irrigated with polluted water can also be dangerous. Heavy metals can also build up in the body causing symptoms of poisoning. | Aluminium; Arsenic; Barium; Copper; Lead; Mercury; Selenium; Silver; Zinc |
| Chlorine and Detergents: Paper and pulp mills use up large amounts of water and produce a lot of polluted wastewater. The wastewater contains strong chemicals such as chlorine, which is used to make paper white and soft. Textile factories also release strong chemicals like caustic soda, acids, dyes and detergents into water. These strong poisons also cause bird and fish kills | Chlorine; Chloramine; Chromium |
| Fertilisers and Nitrates: Some chemicals like fertilisers are made of substances that do occur naturally in the environment, but only in small amounts. Phosphates and nitrates are found in fertilisers, sewage and soaps. The normal low phosphate level in water inhibits the growth of plants but a small increase of phosphates can result in a rapid increase in plant growth such as blue-green algae and water hyacinth, especially in dams. The water plants become overcrowded and die. When they die, the decomposing bacteria uses up more oxygen and affects other forms of life badly, e.g. fish suffocate. This process is eutrophication.
Nitrogen in the form of ammonia and nitrates form part of the plant nutrients that can lead to eutrophication. Nitrogen normally occurs in a form that plants cannot use (i.e. nitrogen gas), however, it may be used in the decomposition of dead water plants and by blue-green algae which can convert nitrogen in the air into ammonia and nitrates that plants can use. |
Ammonia; Nitrates; Nitrites; Total Dissolved Phosphorus; Total Phosphorus |
| Bacteria and Virus in Water: Some of the more dangerous microbial contaminants, such as E. coli, Giardia, and Cryptosporidium, can cause gastrointestinal problems and flu-like symptoms commonly attributed to undercooked or improperly stored food. | Total Coliforms; Fecal Coliforms |
| Salt in Water: When you consume too much sodium, the body holds extra water. The kidneys which filter out waste from the blood, maintain a special ratio of electrolytes, such as sodium to potassium, to water. More salt in the diet means the kidneys keep more water in the system. That can have lots of undesirable effects, such as edema (swelling in places like the hands, arms, feet, ankles, and legs); more fluid in general means more blood coursing through veins and arteries. Over time, that causes them to stiffen, which could lead to high blood pressure | Total Dissolved Salts (at most 600mg/l) |
The above table will form the basis in which data filtering will be done as we focus more on these measures than the rest, due to their undesirable impacts to life.
References
The references for the above-mentioned information came from:
https://www.wqa.org/learn-about-water/common-contaminants
https://www.conserve-energy-future.com/sources-and-causes-of-water-pollution.php
http://www.waterwise.co.za/site/water/environment/substances.html
Back to Dropbox Page
