Difference between revisions of "ISSS608 2017-18-T3-Lokesh-Visualization"
Lokeshv.2017 (talk | contribs) |
Lokeshv.2017 (talk | contribs) |
||
| Line 94: | Line 94: | ||
|- | |- | ||
| | | | ||
| − | <b>[[File:10 11.9.png|500px|centre]]</b> | + | <b>[[File:10 11.9.png|500px|centre|width = "33.33%"]]</b> |
|| | || | ||
| − | <b>[[File:11 11.10.png|500px|centre]]</b> | + | <b>[[File:11 11.10.png|500px|centre|width = "33.33%"]]</b> |
|| | || | ||
| − | <b>[[File:12 11.11.png|500px|centre]]</b> | + | <b>[[File:12 11.11.png|500px|centre|width = "33.33%"]]</b> |
|} | |} | ||
Revision as of 12:41, 8 July 2018
|
|
|
|
|
|
|
|
For the visualization of the Mini Challenge 2, we used the line graphs extensively to understand the tie series trend of the values of each measurement over different locations. This is useful to find the peaks and valleys of all the chemicals and to locate the most potential threat to the Wildlife at Mistford.
As we have 10 different locations, and 106 different chemicals over the past 20 years, we need to plot a visualization that plays around these three important parameters.
Contents
- 1 1. Group - Hydrocarbon chemical’s analysis
- 2 2. Group - Bacteria analysis
- 3 3. Group - Field measurement’s analysis
- 4 4. Group - Heavy metal's analysis
- 5 5. Group - Herbicide / Pesticide / Insecticide (HPC) chemical’s analysis
- 6 6. Group - Metal's analysis
- 7 7. Group - Minerals and Nutrients's analysis
- 8 8. Group - Nitrogen's analysis
- 9 9. Group - Oxygen's analysis
- 10 10. Group - Salt's analysis
1. Group - Hydrocarbon chemical’s analysis
Acenaphthene
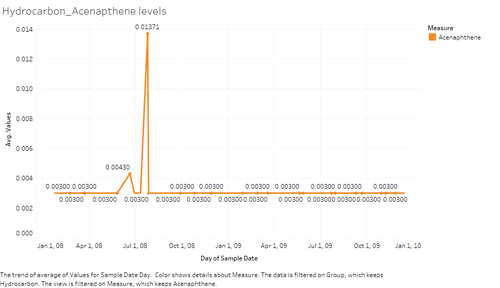
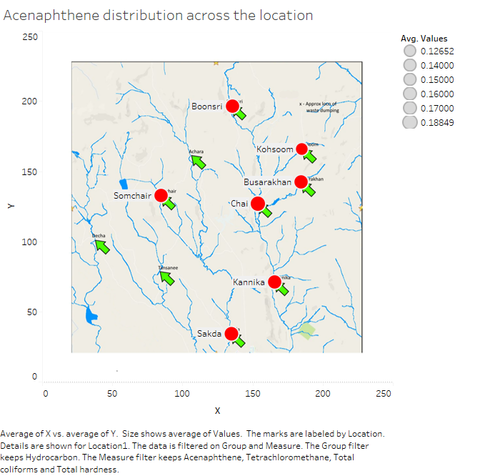
There are a total of 19 chemicals grouped under the Hydrocarbon category. Analyzing the chemical “Acenaphthene” we find that the total values gathered for this chemical only lasts for the period of 2 years and the highest average value recorded at July 2008. Moreover, the Acenaphthene is dumped too much near the Dumping yard, in which the Boonsri and all the locations along its water stream has more average Acenaphthalene.
Petroleum Hydrocarbon
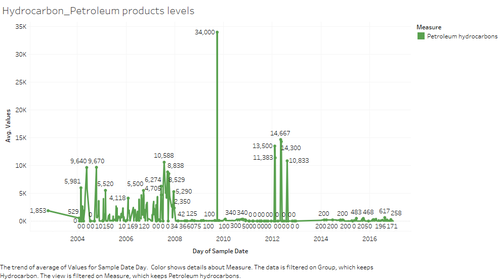
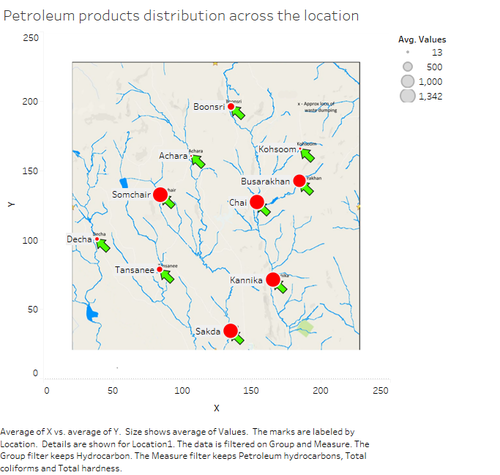
The next hydrocarbon products that we visualize is the most harmful products in the water, the petroleum hydrocarbon. From the below graphs we can confirm that the average value measured over the years is comparatively higher for the petroleum products than any other products. At the end of 2009 and the start of 2010 the amount of petroleum products measured in the water system is too high than the entire 2 decades. After 2012, the measure of these products has reduced tremendously and never rose after that. Over the span, the recorded values were higher for the Chai, Kannika, Sakda, Somchair and Busarakhan.
Benzo (a) Pyrene
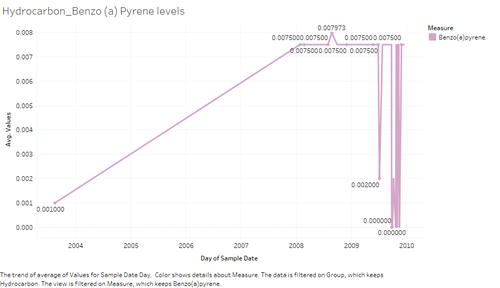
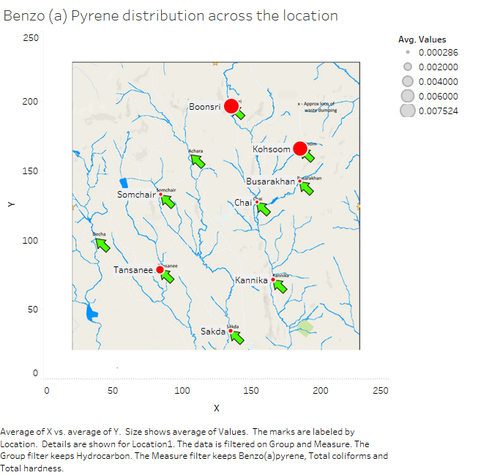
The next hydrocarbon analyzed was the “Benzo (a) Pyrene”. The chemical measures record spans for 6 years from October 2003 till January 2010. Interestingly, the Benzo (a) Pyrene has steadily increased for 5 years, from 2003 till 2009, after that the value has steadied or reduced to 0 from 2009 till 2010. The Benzo (a) Pyrene has concentrated in the Boonsri and Kohsoom location than any other places in Mistford
Tetrachloromethane
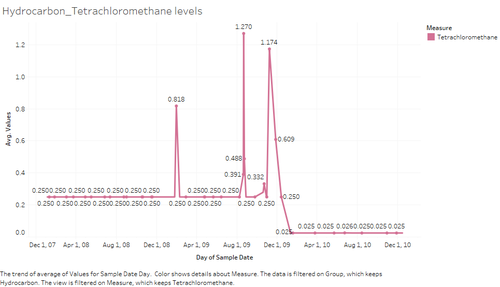
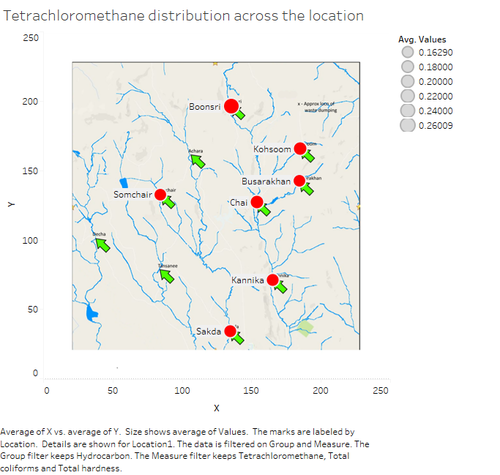
Following Benzo (a) Pyrene, we shall visualize the Tetrachloromethane. This hydrocarbon measure record started from December 2007 and ended at December 2010. The Tetrachloromethane has consistently maintained 0.25 μg/l over the first 2 years, then there was a sudden surge and then came to the 0.25 μg/l. likewise we have three such surges over the span of a year and then it flattened out 0.00 μg/l after December 2009. The tetrachloromethane has concentrated in the right water stream from the source till the dumping plot having the highest recorded value and other places like Somchair and all the places to the right of the median of the Mistford map
2. Group - Bacteria analysis
In the bacterial group there are two dangerous bacteria that harms any life forms present around the water catchment area. They are the Fecal coliforms and then the Fecal Streptococci. Finally, there is a total coliform value.
Fecal Coliforms
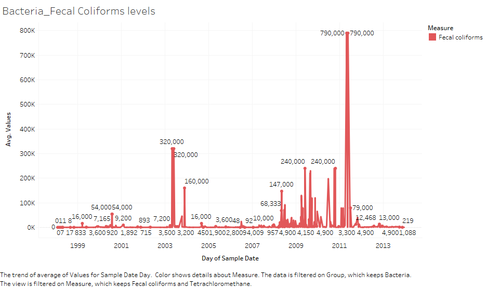
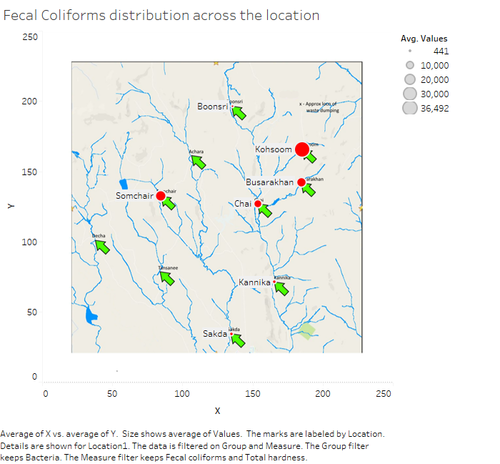
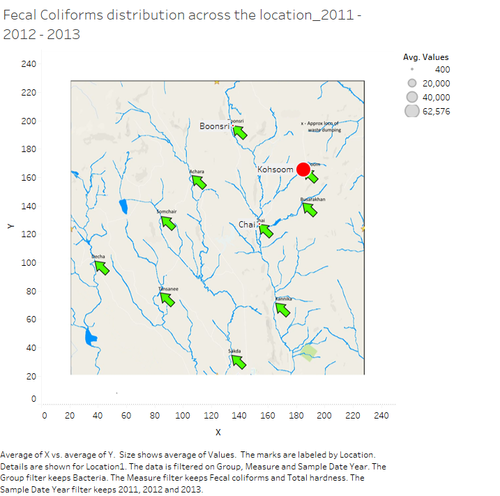
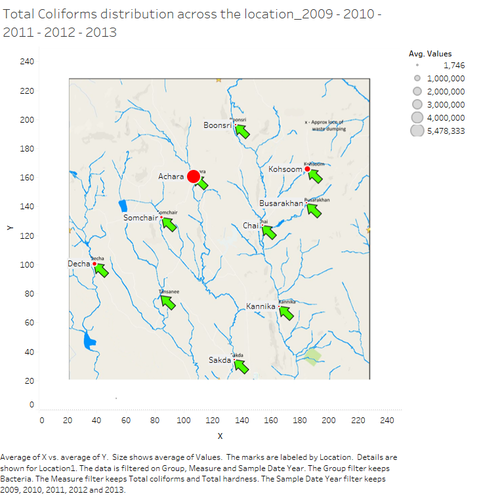
The Fecal coliforms measurements were recorded from mid-1998 till end of 2013. During the mid-2003 the average fecal coliforms crossed the 200K μg/l mark in 5 years. Then end of 2011 or start of 2012 the value of average fecal coliforms rose to the highest ever mark of 790K μg/l almost equivalent to 1 g/l. This is only possible if the number of living organisms were very high during the latter period. The Kohsoom is the location where the highest number of fecal coliforms were found during the 2012-2013 as given in the last image
Fecal Streptococci
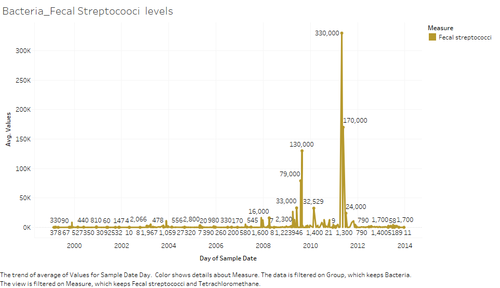
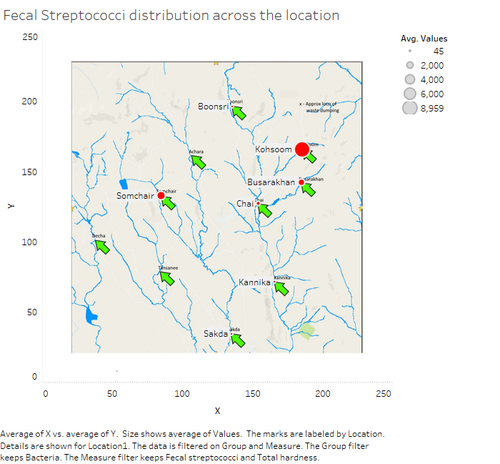
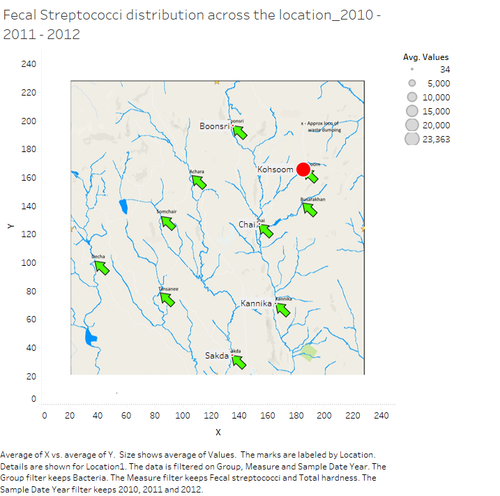
The next bacterial measure that we analyze is the Fecal Streptococci, the recorded value starts from mid-1999 till 2014. The values were all on an average around 1000 till 2008. After 2008 the values started to rise and reached the highest value at mid-2011 of 330K μg/l and then has reduced to an average level of 1200 μg/l. As in the case of Fecal coliforms the highest concentration of streptococci was at Kohsoom during 2011.
Total coliforms
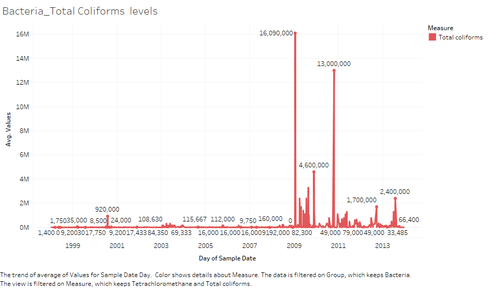
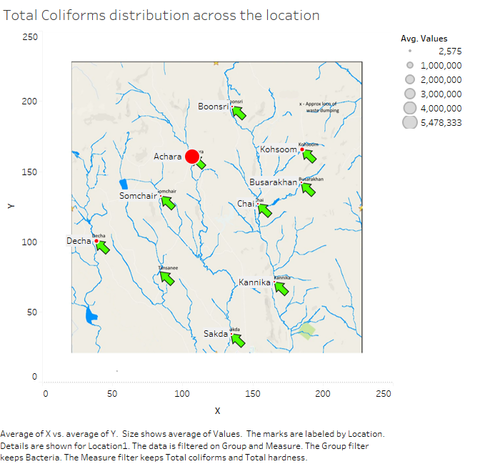
The final bacterial measure that has been analyzed is the total coliforms measure. The values of the total coliforms have been recorded from 1998 till 2014. The trend of the total coliforms is almost within the range of 920K μg/l to 0 from 1998 till 2009. At February – March 2009 there was a sudden surge in spike that almost went to hit 16 g/l and then the value has always been over 50K μg/l. The Achara is the hub for having the highest recorded value in bacterial measures over the 2 decades.
3. Group - Field measurement’s analysis
Anionic Surfactants
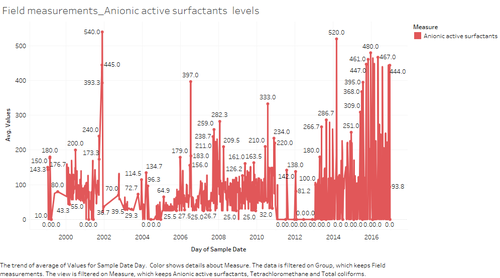
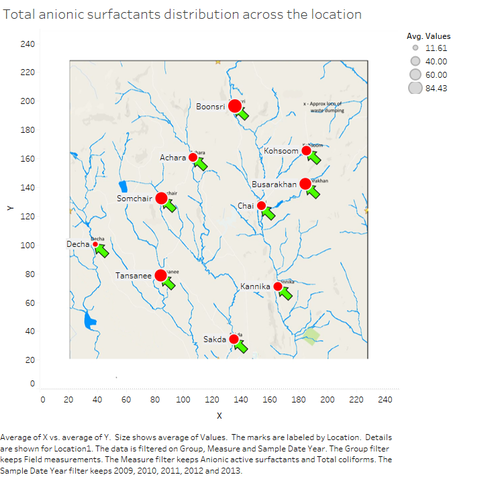
The anionic active surfactants are lathering agents found in water streams which greatly alter the nature of water and environment for fishes and other living organism which are dependent on the water. The Mistford Anionic active measurements values were taken from 1999 and ended at the end of 2016. As per the suggestions from the journal “Spectrophotometric determination of anionic surfactants in waste water using acridine orange” (Ref 1) has confirmed that the maximum limit for anionic active surfactants in drinking water must be less than 500 μg/l. In the analysis we find that almost over all the years the limit has been below the maximum limit, except at January 2002 and in January 2014. Boonsri and Tansanee are the places where the values measured were the highest, while all the other places too had quite a nominal average value of surfactants. The least average measured value is recorded at Decha.
Total extractable matter
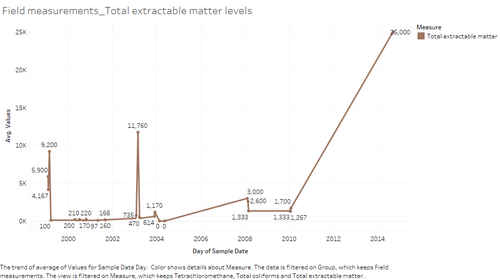
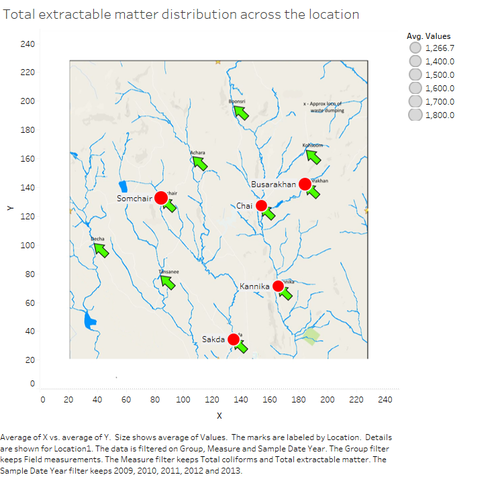
Next, we shall look upon the analysis of the total extractable matter from the water over the years. The value was less than 5000 between 1998 till 2010, except for having two spikes on 1999 and 2003 which rose to 10,000 μg/l. But after 2010 there has been the record of continuous increase in the total extractable matter in a strict linear way. This shows that the dumping into the water is on a large scale after 2010, which indirectly suggest us the regions near the dumping yard should have the highest value recorded. Affirmatively we see that Boonsri recorded higher value of dumping of extractable matter, besides it the entire water stream of Boonsri is recorded with higher extractable matter over the years. This is clear from the second image.
Total Hardness
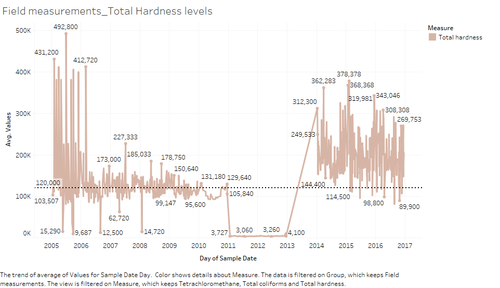
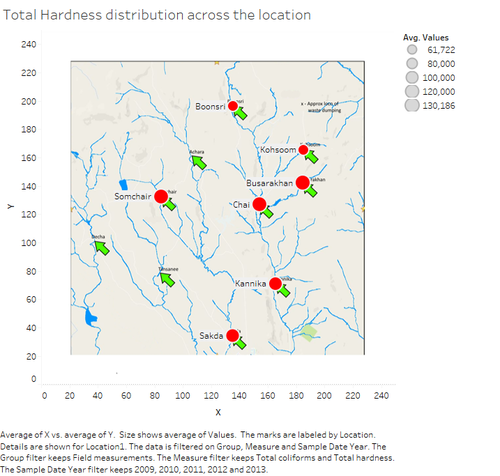
The next measure’s analysis that we will see is the Total Hardness of the water. From (Ref 2) we can see that any water that contains more than 120 mg/l is considered hard water, all hard water will have overdose of calcium and magnesium levels in the water. The total hardness is calculated to the water samples from across the city for 12 years from 2005 till 2017. We can analyze from the plot that the average total hardness value is more than 120 mg/l, which indicates that the water running in the streams is too hard. The 12 years average for the 10 locations gives us 147 mg/l which is the evidence for the analysis. Places such as Somchair, Chai, Busarakhan, Sakda, Kannika have consistently too high total hardness in water.
Water Temperature
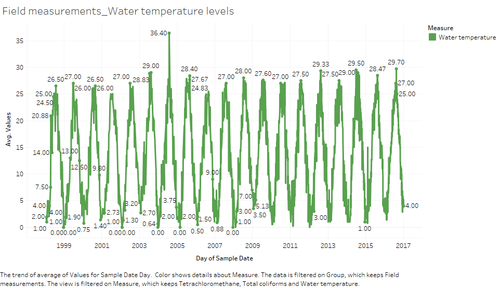
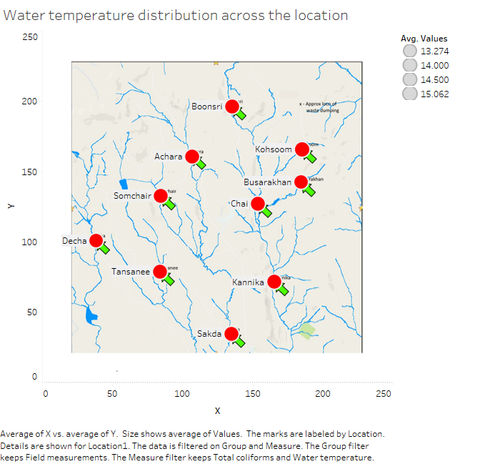
The final field measurement that is analyzed is the water temperature. This is one of the important parameter to be analyzed for the overall environment analysis of proper living. The water temperature changes every year during the summer and winter, moving from nominal temperature to freezing temperature. From the image 11.24 we can clearly understand that the water temperature is in a cyclic trend. But on 2004 summer the average temperature crossed beyond the normal average and reached 36.40-degree C. All the locations irrespectively has the same average temperature of 13 – 15 degree C.
4. Group - Heavy metal's analysis
In the heavy metal category there are many metals that can be discussed, in this analysis we shall see the top 4 most lethal and potential influencing metals
Arsenic
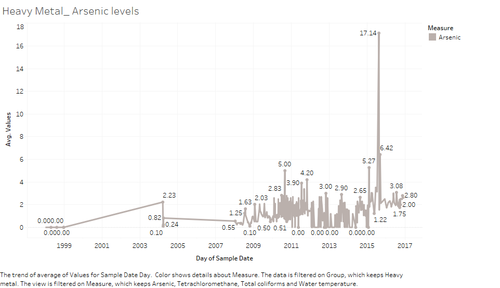
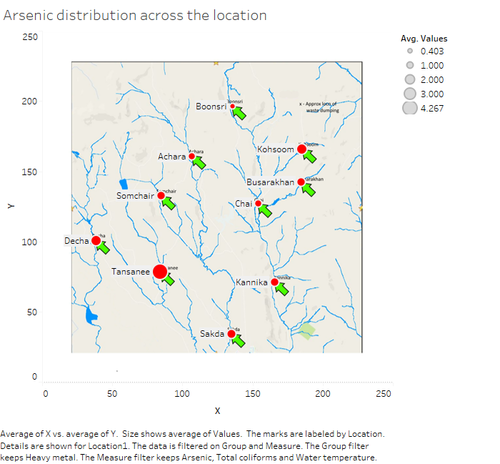
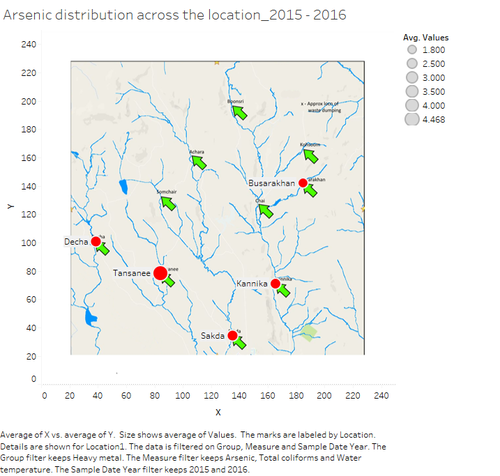
The first analysis is for the metal Arsenic – one of the most poisonous metal if consumed more. From the (Ref 3) we see that the maximum limit of arsenic in a drinking water should be below 10 μg/l. The arsenic content measures are taken over the entire 2 decades, and the average is around 3 μg/l. But during the end of 2015 and start of 2016 the arsenic content shoot to a huge 17.14 μg/l, which is very lethal for any organism consuming the water. The bottom half for places are having a comparatively higher concentration of average arsenic value than the top 6 places. The Tansanee has it water highly concentrated with arsenic during the 2015 – 2016 period.
Lead
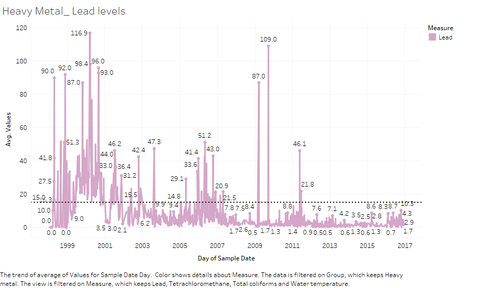
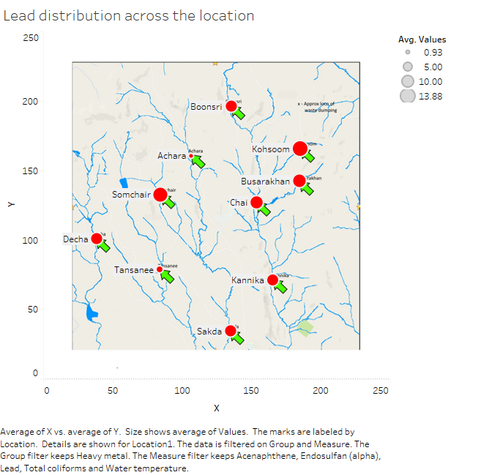
The next heavy metal is the lead. According the government recommendation (Ref 4), the drinking water must have a maximum limit of 15 μg/l of lead in it to consider itself good for drinking. During the start of the sample record collection, the lead contamination in the water is so high. But after 2011 the value has always remained below the maximum limit till 2017. The highest average lead contamination in the water is from the Kohsoom followed by the Somchair, while all other places were having almost the same average values
Zinc
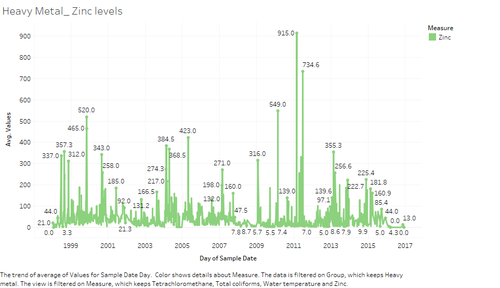
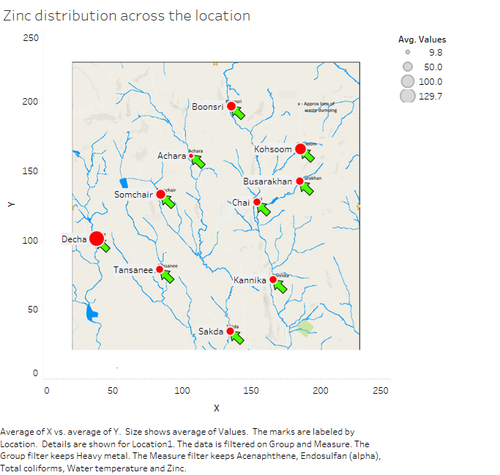
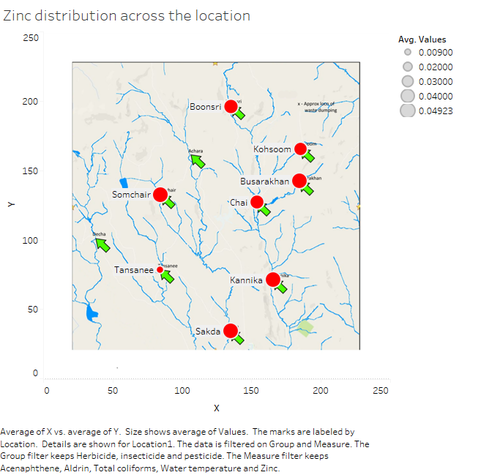
The next heavy metal is the Zinc. Zinc is not as harmful as the other above two heavy metals. The zinc is helpful for all the animals in their basic body functions. We analyze from the Mistford that the values over the years have been erratic and random. During the mid-2011, the average zinc content in the entire city reached the ever-maximum concentration of 915 μg/l. The total average of zinc concentration in the entire city is 21 μg/l. Likewise, when considering the location distribution of zinc, the Decha is the place where the average zinc concentration is so high compared with the other places. Following the Decha is the Kohsoom.
Mercury
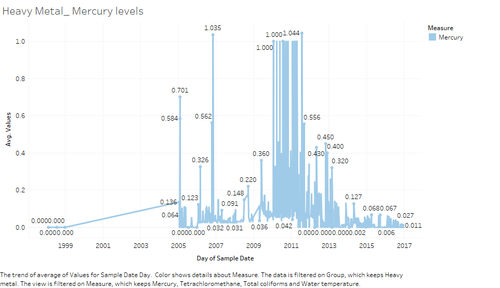
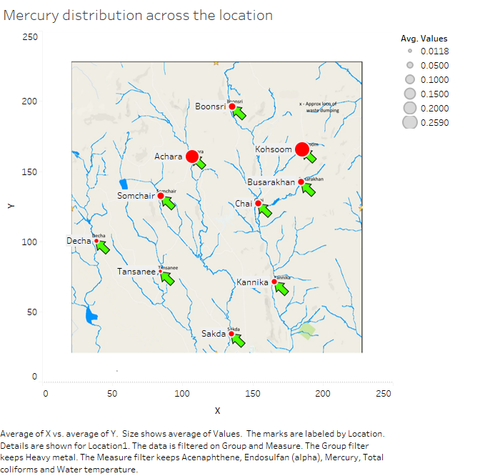
The final heavy metal that is to be analyzed is the mercury. The mercury is one of the most poisonous metal. It is very harmful to living organism directly killing the kidneys and blood of an organism (Ref 5). The allowable or the maximum contaminant level of mercury in water is 2 μg/l. The analysis of Mistford gives the average overall mercury in the waterways is 0.078 μg/l. The waterways is not harmful to nay living things on the cause of mercury. The Kohsoom is the place where the average mercury contamination is the highest, followed by the Achara and Boonsri.
5. Group - Herbicide / Pesticide / Insecticide (HPC) chemical’s analysis
The HPC measures are chemicals that contain powerful toxic chemicals that are used to kill the pests, insects and herbs that eats the plants that are cultivated. There is a total of 14 chemicals grouped into this category.
Aldrin
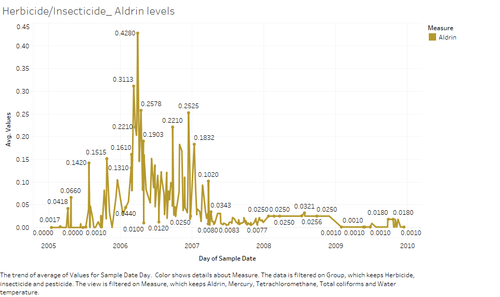
First, we shall see the HCP-Aldrin. The aldrin is a pesticide that are used in the Mistford agricultural places to get rid of the pests. The Aldrin is measured in the water started only from 2004 and ended at 2010. In that duration, the level of aldrin is distributed in a pseudo normal distribution method. The maximum value of the average aldrin level is during the mid-2006 and then went on reduce to 0 μg/l at the end of the calculation. The Somchair possess the highest average contamination value for aldrin followed by the Sakda and then by the Busarakhan.
Dichlorodiphenyldichloroethane – DDD
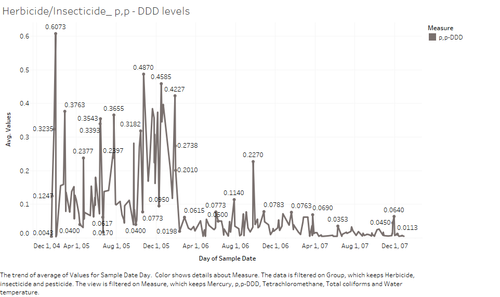
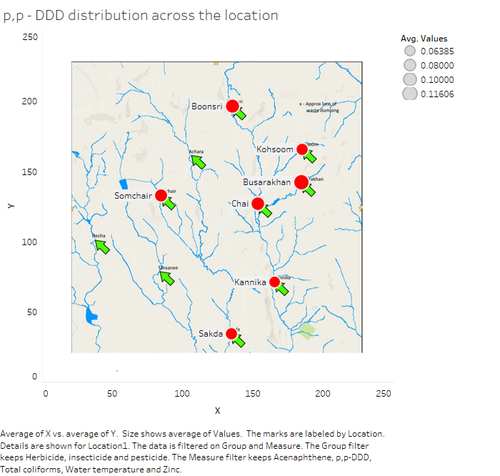
The next HCP measure taken for analysis is the Dichlorodiphenyldichloroethane – DDD. The DDD is a very strong pesticide generally used in agricultural practice. In Mistford the DDD measurements were started recording on December 2004 and ended at December 2007. Till December 2005 the average values witnessed a huge fluctuation and after that the values have almost averaged out at 0.058 μg/l. With regards to the location, the Busarakhan tops the places in the average value of DDD contamination in the water, followed by the Boonsri.
Alachlor
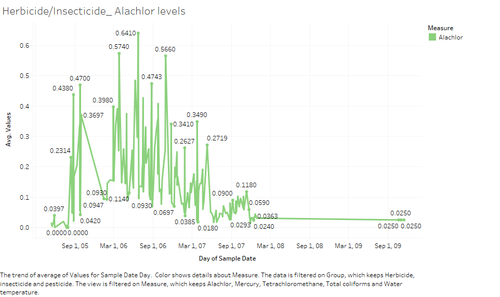
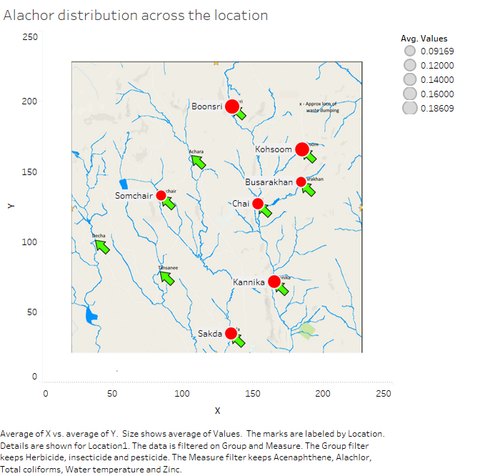
Here, we shall the analyze the Alachlor – herbicide. The alachlor’s recordings from the different places started at September 2005 and stopped at September 2009. The values have been very fluctuating over the period between 2005 and January 2008. After February 2008 the values steadied up at 0.03 μg/l. The Boonsri has the highest average value of Alachlor recordings while the Kohsoom stands second in the list.
Methoxychlor
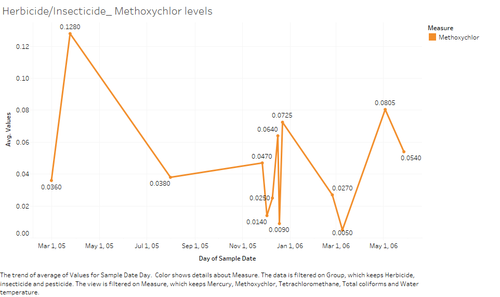
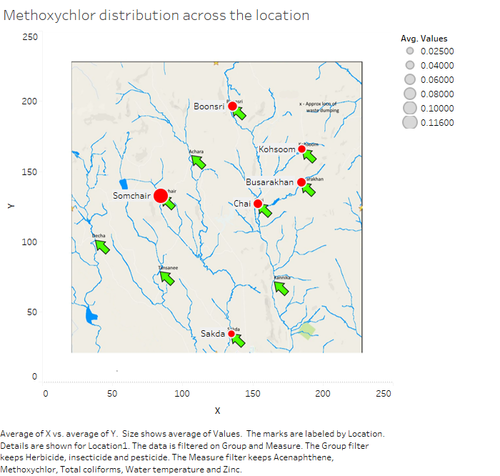
The Methoxychlor is an insecticide used to kill the insects eating the agricultural plants. In Mistford the methoxychlor’s readings are taken only for a year, from May 2005 to May 2006. With just one year’s readings, the values still were fluctuating more between 0.005 to 0.12. The Somchair headed the places with having the highest average methoxychlor in the Mistford. Following Somchair, it’s the Boonsri.
6. Group - Metal's analysis
With having analyzed on the hardness and other chemicals already, this metal analysis gives more intense analysis of each metals which constitutes the water to a larger scale. They include Boron, Calcium, Magnesium, Potassium, Sodium etc., We shall analyze them in detail:
Calicum
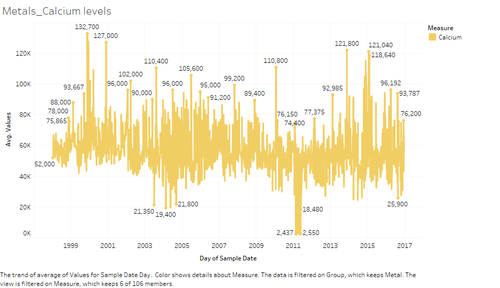
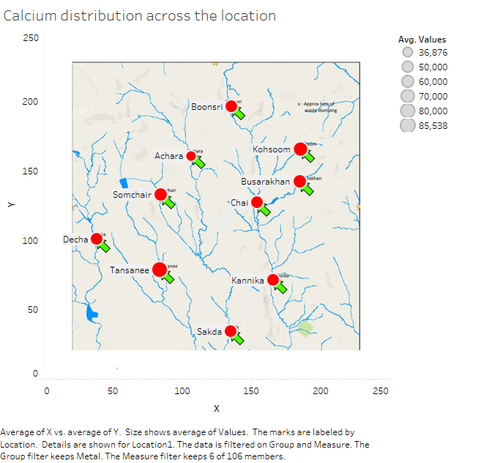
First, we shall analyze the Calcium. The calcium appearing as salts, is one of the major constituents of water which determines the hardness of the water. In Mistford the records for calcium have been taken from 1998 till 2017. The values have always kept on fluctuating and has reached the highest during the 2000 and has reached the lowest average values at 2011. The mean of the average values of all the calcium values is 56 mg/l. When considering the distribution of the calcium levels across the cities, we see that the Tansanee has the highest average concentration of calcium in Mistford, following it are the Kohsoom, Busarakhan and Somchair.
Magnesium
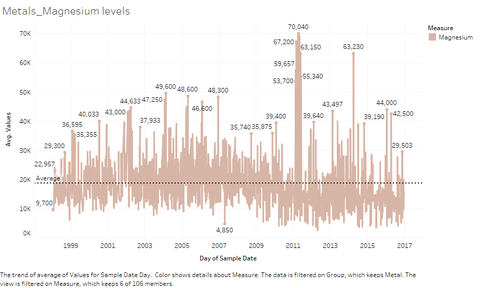
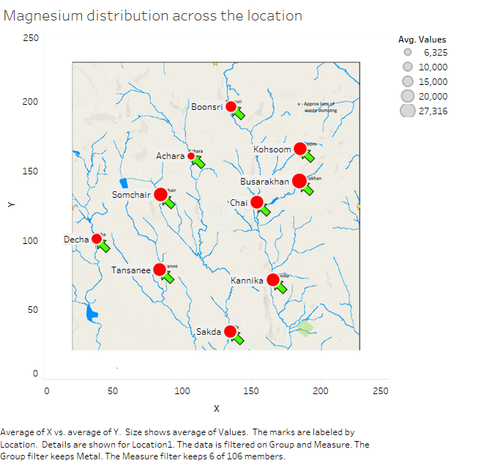
We shall analyze the Magnesium metal in the water system across the region. The Magnesium is another metal usually present in the form of salts in the water. The analysis has been taken from 1998 till 2017. The average of the values of the magnesium in the total 20 years of all locations data is 18 mg/l. During February – June 2011, the Magnesium levels in the region were so high, crossing the permissible limit. When considering the distribution of the magnesium levels across the cities, we see that the Busarakhan has the highest average concentration of magnesium in Mistford, following it are the Kohsoom, Somchair, Chai, Kannika and Tansanee.
Potassium
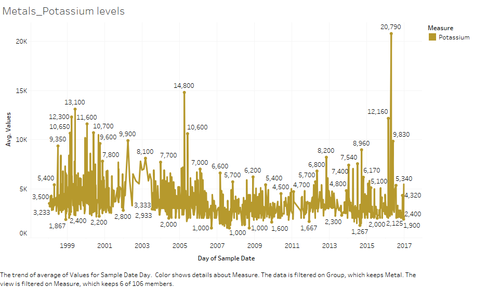
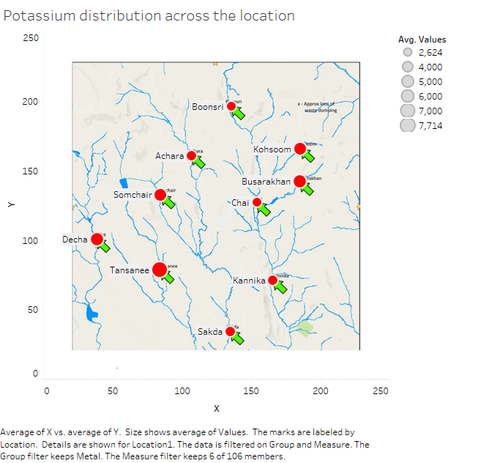
Next, the analysis has been done for the metal – Potassium. We have the values of the potassium mixture spread across the locations from 1998 till 2017. In general, the values of the magnesium are lying between the 1 mg/l to 15 mg/l over the duration of recordings. But from April 2016 the values were so high of 20 mg/l. Considering the locations, the Tansanee has the highest average of potassium values among the other locations. Following the Tansanee, the Decha and Busarakhan has almost the same average potassium value.
Sodium
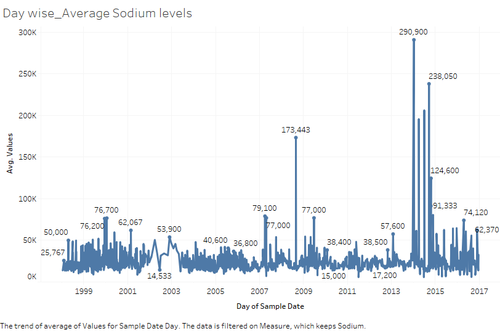
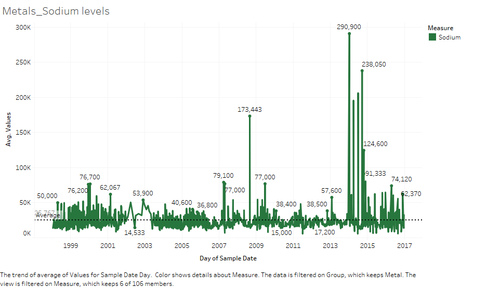
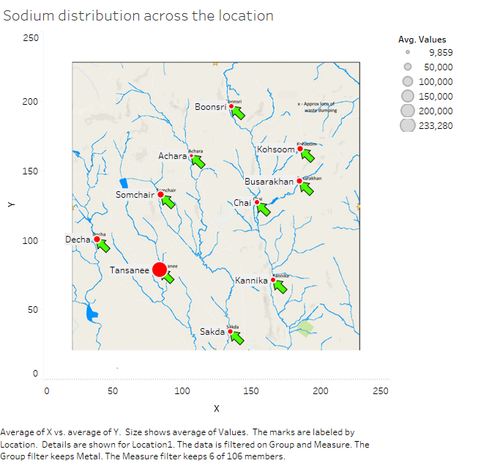
Finally, we shall analyze the Sodium in the water. The sodium occurs in the water in the form of salts. Generally, if the water contains more than 60 mg/l the water becomes too salty for drinking, anything less than the value is permissible for drinking. In the trend graph for average sodium levels over the 20 years, we find that the value crosses the 60 mg/l almost all the times, the water is too salty for drinking. The mean average value of the sodium in the Mistford is 25 mg/l. the highest value of sodium reached a massive 290 mg/l during the January 2014. The Tansanee recorded the highest sodium levels on January 2014. Tansanee recorded a massive 233 mg/l over the 20 years. Other locations have a very minuscule concentration of sodium well below the permissible level.
7. Group - Minerals and Nutrients's analysis
Minerals and Nutrients have been grouped because there were nonmetallic, inorganic chemicals that are also present along with the other chemicals. The nonmetallic, inorganic chemicals are very much present in the water that has always been taken by the water and the minerals present in the sand carried by the stream.
Silica-(Sand)
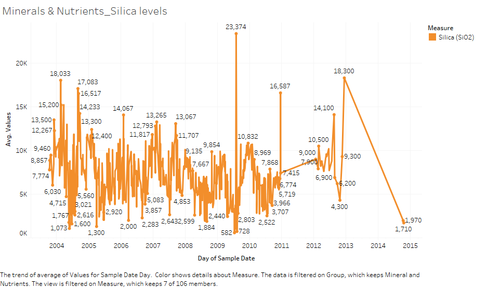
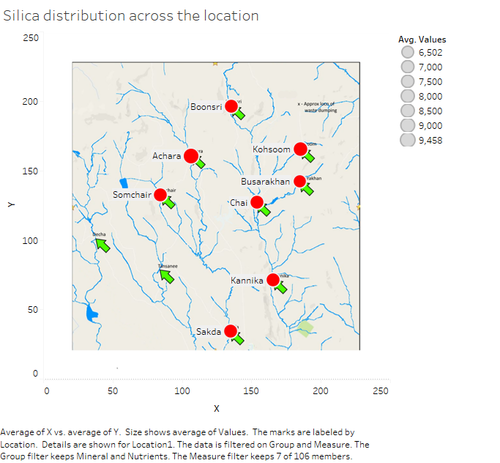
The first mineral taken for analysis is the Silica(sand). The sand is the mineral that is the foundation of any water basin. The sand sometimes gets always carried as a colloid with the water, so there is always certain amount of sand per liter of water carried by the river. The Mistford should have a rough waterways and lot of turbulence, hence over the 20 years the silica contained in the river has its values between 0.58 mg/l to 23 mg/l and an average of 7 mg/l. During the July 2009, the amount of silica carried by the sand was the highest carrying 23 mg/l. while after 2013 the water has steadily dropped the amount of silica carried till the end of 2016. With regards to the location, the Achara regions water carried an average of 9 mg/l overall, while the Kohsoom has 8 mg/l and the other places near the dumping has almost equally 6 mg/l for those locations.
Total Phosphorus
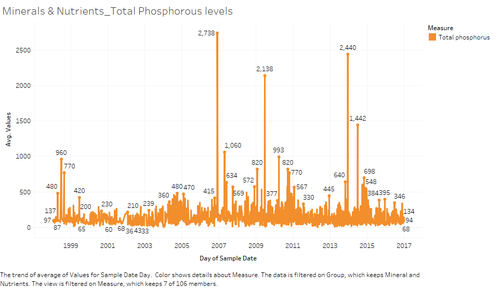
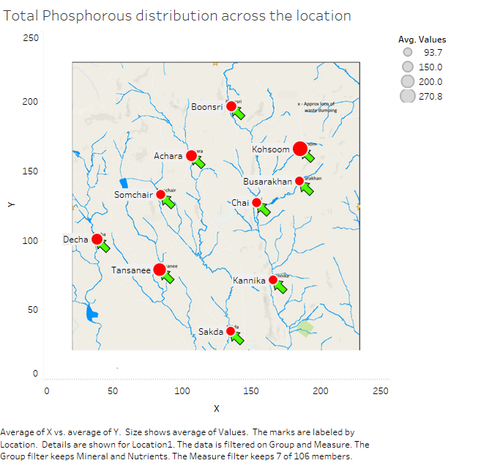
Secondly, we shall see the analysis of total phosphorus in the Mistford. Phosphorous is a very good mineral needed for agriculture. Hence the mineral is present in the waterways. The total phosphorous for Mistford is taken from 1998 till 2016 has an average value of 135 μg/l while the November 2006, June 2009, December 2013 had the total phosphorous content of over 2 mg/l. After 2013 spike, there has always been a downward trend in the value till the end of 2016. This clearly shows that the total count is likely to reduce in 2017. Regarding the locational value distribution, Kohsoom has the highest average total phosphorous value of 270 μg/l. Following that Tansanee has the average value of 200 μg/l. All the other locations have a little less average value equally among them.
Total Nitrogen
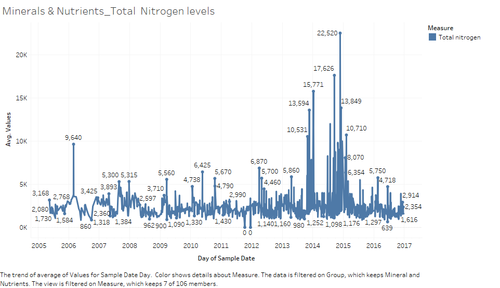
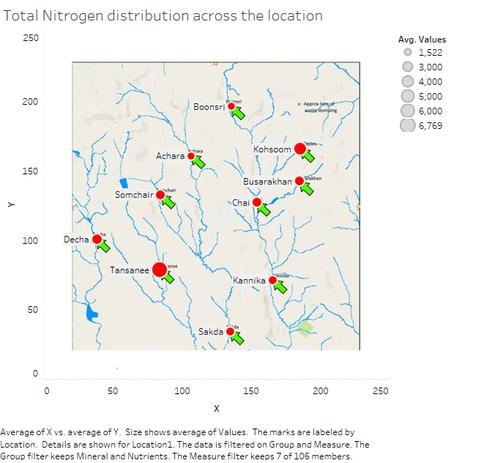
The next mineral for the analysis is the Total Nitrogen. The water flowing will naturally imbibe free nitrogen into it and can have the dissolved nitrogen in it. The Total nitrogen records have been taken from 2005 till 2016. The density of spikes is more concentrated towards the records of 2013 – 2016. Moreover, the average value for the dissolved total nitrogen is the highest during November 2014 with 22 mg/l. Then it suddenly dropped to 6 mg/l in a span of 8 months. The average total nitrogen value is the highest for Tansanee followed by Kohsoom.
8. Group - Nitrogen's analysis
There is a separate group for the nitrogen which includes, Inorganic Nitrogen and Organic Nitrogen. The total nitrogen which was already considered is for only the free nitrogen. But this group uses the two-different compound sector of nitrogen.
Inorganic Nitrogen
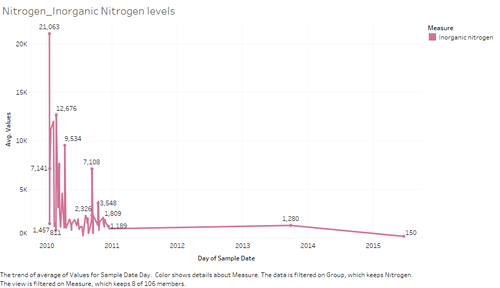
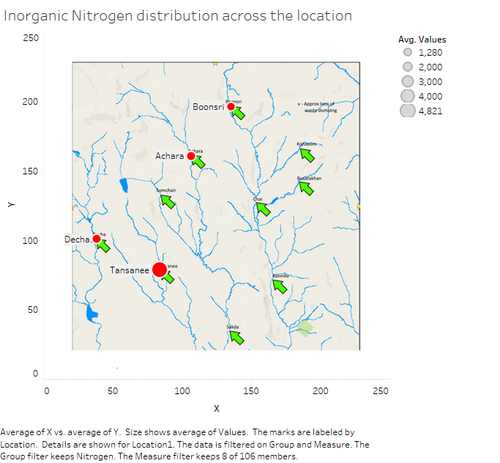
We shall first analyze the Inorganic nitrogen, which was recorded from the locations only after 2009. The total inorganic nitrogen was so high initially of 20 mg/l and then in a year at 2011, the value dropped to less than 1.5 mg/l. The average value has remained the same from 2011 till 2015, and then dropped less than 1 mg/l at mid-2015. During this 6 years of record, the average inorganic nitrogen is the highest for the Tansanee followed by Achara, likewise by Decha and then by Boonsri.
Organic Nitrogen
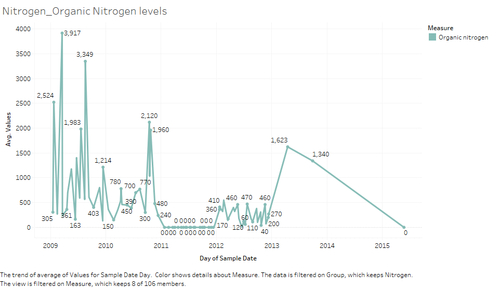
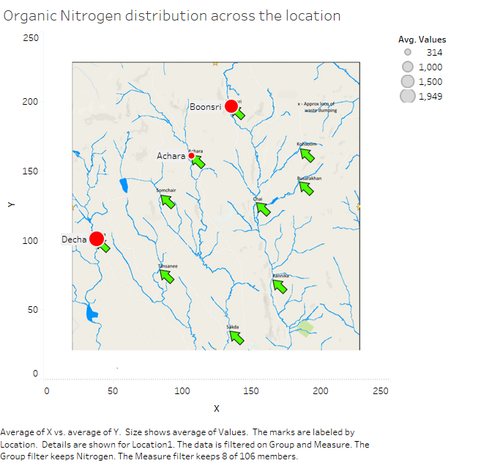
The second analysis in this group is the organic nitrogen analysis. The organic nitrogen records over all the locations in the waterways has been recorded from 2009 till 2015. Initially the average value was so high and then like the inorganic nitrogen, then the values fell back down the level and finally reached zero. The highest level of organic nitrogen was at March 2009, with a value of 3.9 mg/l. interestingly the focus of the organic nitrogen is only confined to two locations, Decha and then Boonsri.
9. Group - Oxygen's analysis
Oxygen is the most vital chemical that is needed for any living organism to thrive. There must be optimum oxygen in the water for fishes and algae to thrive hence indirectly influencing the other organism dependent on them. There are various parameters inside the oxygen category that could be substantially calculated to measure the overall scenario. COD, dissolved oxygen, BOD, Biochemical oxygen, oxygen saturation.
Chemical Oxygen Demand (COD)-Cr
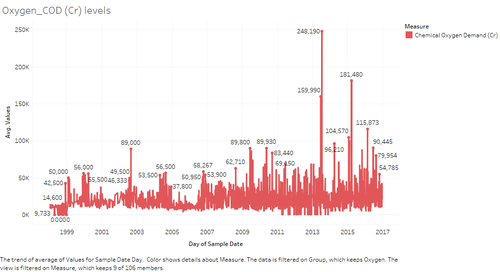
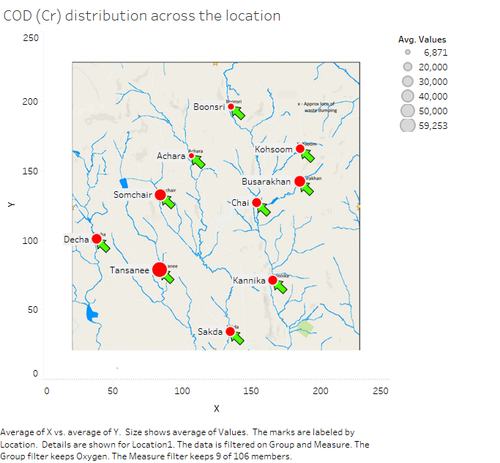
First, we shall analyze the Chemical oxygen demand (Cr) (COD Cr). The COD (Cr) is the measure of the chemical oxygen demand in a water ecosystem calculated using the strong oxidizing agent such as the potassium dichromate (K2Cr2O7). Higher the COD, lesser will be the dissolved oxygen present in the water. As a normal practice, the COD level must not be greater than 250 mg/l from an effluent base of an industry as given in the (Ref 6). In the Mistford all the COD (Cr) is less than 250 mg/l, but during July 2013, the COD value went as high as 249 mg/l, which indicates that too much oxidable matter were dumped to the water system. With respect to the location, the Tansanee is having the highest average COD (Cr) value compared with other locations. Moreover, all the locations have been recorded with a reasonable COD (Cr) values.
Dissolved Oxygen
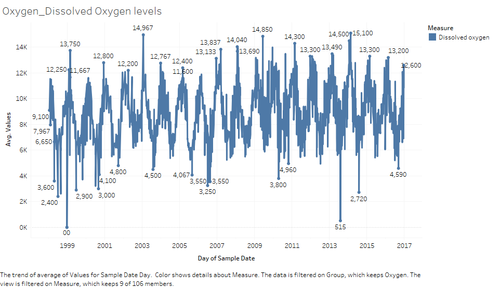
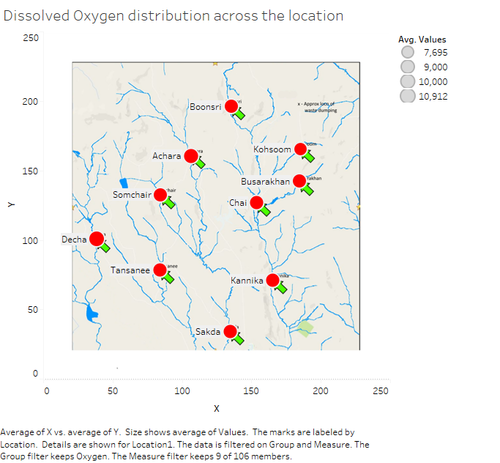
Next, we shall analyze the Dissolved oxygen. This is the most important parameter in the oxygen category which determines the direct growth or decline in organisms in water. The dissolved oxygen must always be higher, which indirectly say the water is clean for living organism, provided other parameters are with acceptable limit. The analysis of Mistford waterways dissolved oxygen gives us some interesting insights. The dissolved oxygen has always fluctuated with proper cycle over the years. If we clearly analyze the data, the dissolved oxygen has always found to be decreasing during the mid-quarter of the year (from June till August). The dissolved oxygen has almost reached zero mg/l during the December 1998, while it has reached the maximum during January 2003. The mean of the average dissolved oxygen values has been at 8 mg/l. with respect to the location, all the location invariably has the same average dissolved oxygen values.
Oxygen Saturation
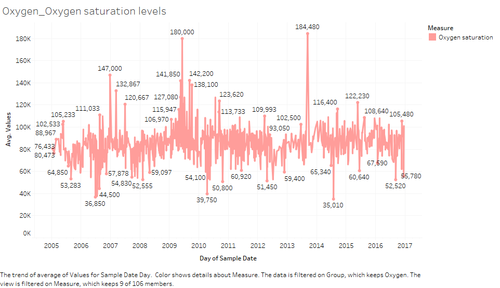
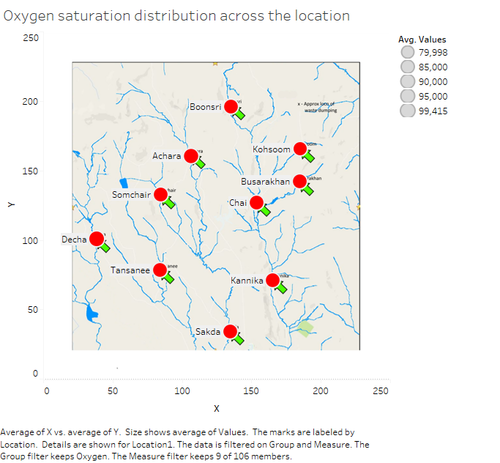
The final oxygen group’s parameter that we analyze is the oxygen saturation. The oxygen saturation is defined as the maximum limit of dissolved oxygen in a water system, depending on the water temperature oxygen in the atmosphere, type of water as well. Generally, for a proper river water, the oxygen saturation limit if around 14 mg/l. But on the analysis of Mistford, the values are very much higher than the nominal, which with certainty could be claimed that the river consumer too much oxygen for oxidizing the matter, thereby increasing the limit of oxygen saturation. Oxygen saturation only depicts the dissolved oxygen, i.e., oxygen saturation is calculated until the water system reaches its dissolved oxygen limit. The Mistford gives us the proper correlation between the dissolved oxygen, COD (Cr) and the oxygen saturation. The oxygen saturation will be higher when the COD(Cr) is higher, and that is clearly visible in the analysis. The oxygen saturation recordings have been taken only from 2005 till end of 2016. Like the dissolved oxygen, the oxygen saturation also is evenly distributed over the years across the location.
10. Group - Salt's analysis
After all the chemicals that has been analyzed, we have come to the final constitution of chemicals in the water, is the salts. There are lot of salts present in the water generally and need to be analyzed for checking the present limit in the water and check for those that threaten the environment. There are many salts present in the water such as the nitrates, nitrites, sulphates, sulphides, total dissolved salts etc.
Total Dissolved Salts
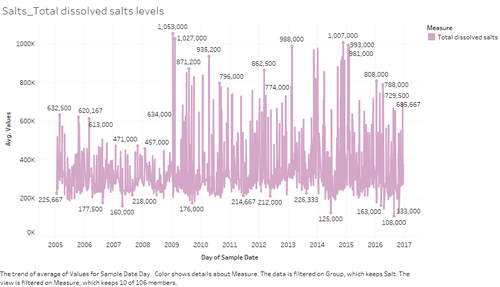
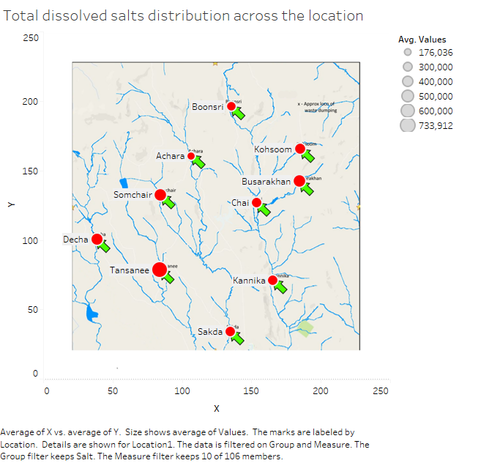
Firstly, the analysis is for the total dissolved salts present in the water. The total dissolved salts records have been taken from all the locations from 2005 till the end of 2016. The total dissolved salts ranges from 108 mg/l till 1 g/l over the period. The mean total dissolved salts in the water is 343 mg/l. This is too much for the water to be less salty, the concentration of salts are so high in the water. After 2009, the average value of the total dissolved salts has increased tremendously. In the analysis of the locations, the Tansanee has the highest average total dissolved salts when compared with the other locations. Following the Tansanee, the Busarakhan has the highest average total dissolved salts over the years.
Bicarbonates
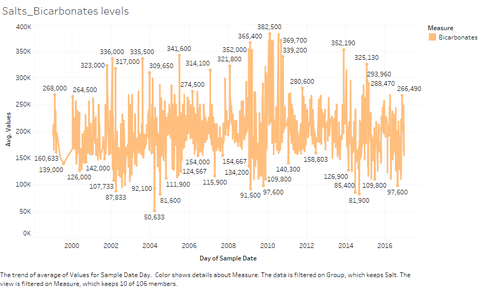
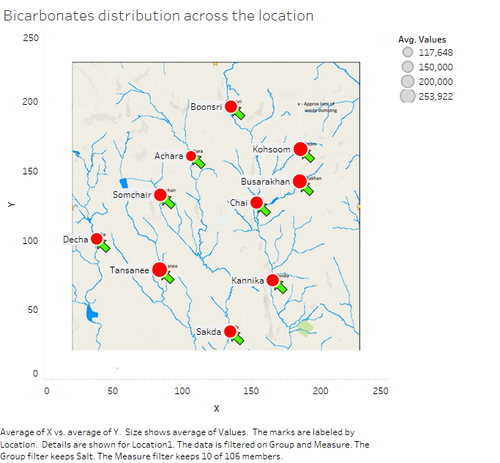
Next, we shall be analyzing about the Bicarbonates present in the water. The bicarbonates of Calcium and Magnesium is the primary cause of increase in the hardness of the water. In Mistford, the mean average value of the bicarbonates present in the water is around 190 mg/l, which is a little more than the permissible limit, hence the water in the entire region is having water with high hardness. From 2009 till 2011, the overall mean average bicarbonates are higher than the mean of the range of years. This infers that more bicarbonates have been in input into the water system compared with other years of action. In location analysis, the Tansanee possess the highest average bicarbonate value, while the least average value is at Achara.
Chlorides
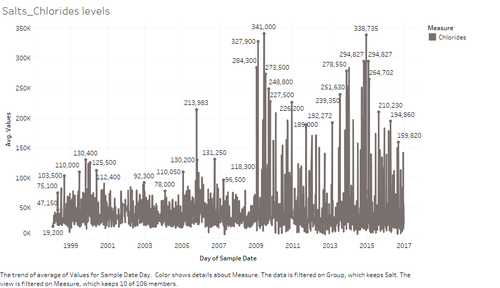
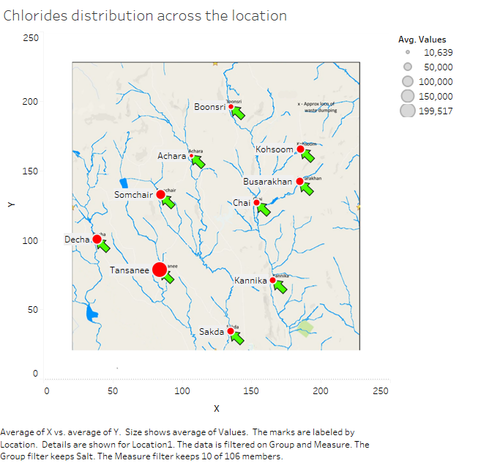
Finally, we shall be analyzing about the salts of chlorides in the water, generally the chlorides are the major constituent of the salts in any water system. From the start of the measure’s recording from 1999 till 2008, the values were all at a lower value with just a single spike on October 2005. After 2009, the overall mean of the average chlorides salts present in the water has increased exponentially, during 2010 and in 2015 the total chlorides present in the water reached the maximum limit causing the water in Mistford too much acidic. For locations, again the Tansanee possess the highest mean average chlorides salts in the Mistford calculated over the years.

