Difference between revisions of "IISSS608 2017-18 T3 Assign Vigneshwar Ramachandran Vadivel- Data Cleaning"
Jump to navigation
Jump to search
| (14 intermediate revisions by the same user not shown) | |||
| Line 1: | Line 1: | ||
{{Template:MC3 Header}} | {{Template:MC3 Header}} | ||
| + | |||
<!------- Main Navigation Bar----> | <!------- Main Navigation Bar----> | ||
<center> | <center> | ||
| Line 22: | Line 23: | ||
<center> | <center> | ||
{| style="background-color:#ffffff ; margin: 3px 10px 3px 10px;" width="80%"| | {| style="background-color:#ffffff ; margin: 3px 10px 3px 10px;" width="80%"| | ||
| − | | style="font-family:Open Sans, Arial, sans-serif; font-size:15px; text-align: center; border-top:solid #f5f5f5; background-color: # | + | | style="font-family:Open Sans, Arial, sans-serif; font-size:15px; text-align: center; border-top:solid #f5f5f5; background-color: #f5f5f5" width="150px" | |
| − | [[ISSS608_2017-18_T3_Assign_Vigneshwar Ramachandran Vadivel_Approach|<font color="#3c3c3c"><strong> | + | [[ISSS608_2017-18_T3_Assign_Vigneshwar Ramachandran Vadivel_Approach|<font color="#3c3c3c"><strong>About Dataset</strong></font>]] |
| − | | style="font-family:Open Sans, Arial, sans-serif; font-size:15px; text-align: center; border:solid 1px #f5f5f5; background-color: # | + | | style="font-family:Open Sans, Arial, sans-serif; font-size:15px; text-align: center; border:solid 1px #f5f5f5; background-color: #fff" width="150px" | |
[[IISSS608_2017-18_T3_Assign_Vigneshwar Ramachandran Vadivel-_Data_Cleaning|<font color="#3c3c3c"><strong>Data Cleaning</strong></font>]] | [[IISSS608_2017-18_T3_Assign_Vigneshwar Ramachandran Vadivel-_Data_Cleaning|<font color="#3c3c3c"><strong>Data Cleaning</strong></font>]] | ||
| − | |||
| − | |||
| − | |||
| − | |||
| − | |||
|} | |} | ||
</center> | </center> | ||
| + | |||
<!------- End of Secondary Navigation Bar----> | <!------- End of Secondary Navigation Bar----> | ||
| − | |||
| − | |||
| − | Using Tableau prep all the four data can be merged and transformed into our necessary format. | + | =<div style="font-family: Calibri;">Communication Data= |
| − | + | <div style="font-family: Calibri;">Initial part of our analysis requires us to explore the communication pattern of the company. In order to analyse the pattern, we have to combine the four-communication dataset of Kasios into one single data to have the holistic view. | |
| − | The date format of the data has been given in Unix epoch timestamp beginning from May 11, 2015 at 14:00. To transform this into our timestamp value we can derive the following calculated field | + | Using Tableau prep all the four data can be merged and transformed into our necessary format.<br> |
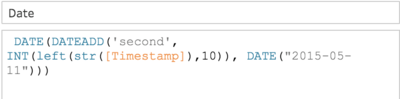
| − | + | The date format of the data has been given in Unix epoch timestamp beginning from May 11, 2015 at 14:00. To transform this into our timestamp value we can derive the following calculated field, | |
| − | [[File: | + | [[File:A1_MC3_Timestamp.png|400px|centre|frameless|link=ISSS608_2017-18_T3_Assign_Vigneshwar Ramachandran Vadivel |
| + | ]] | ||
| + | =<div style="font-family: Calibri;">Network Data= | ||
| + | <div style="font-family: Calibri;">Once we transform our data we can explore the communication pattern and growth of the company with this merged dataset. | ||
| + | For our later part of the analysis the data has to be transformed in such a way that it would be readable on Gephi for basic network visualisations. Using the insider kasios suspicious data, I created edges and nodes for our network visualization.<br> | ||
| + | The following flow shows the data processing involved in this process using Tableau prep,<br> | ||
| + | [[File:A1_MC3_Data_Flow.png|900px|centre|frameless|link=ISSS608_2017-18_T3_Assign_Vigneshwar Ramachandran Vadivel | ||
]] | ]] | ||
| + | ==<div style="font-family: Calibri;">Aggregated Communication Data== | ||
| + | <div style="font-family: Calibri;">To create the edges csv file: | ||
| + | <ol><li>Concatenate communication data for all different transactions into one source of information.</li> | ||
| + | <li>Change column data type of "From" and "To" from continuous to nominal. | ||
| + | <li>Rename columns "From" and "To" to "Source" and "Target".</li> | ||
| + | <li>Create a column "Type" and ensure that all the fields of the column are filled with "Directed" - This helps to specify the direction of the communication.</li> | ||
| + | <li>Create a new column with the formula "Source || Target", as this concatenates the Source and Target column.</li> | ||
| + | <li>Use the tabulate function to count the number of times the concatenated cell appears in the column - this helps to find out the weight of the unique direction of communication.</li> | ||
| + | <li>Update the table with the weight of the column. Change the column name to "Weight".</li> | ||
| − | + | </ol> | |
| − | + | <div style="font-family: Calibri;">To create the nodes csv file: | |
| − | + | <ol><li> Merge the company index with the combined file together and find out the unique nodes present in the edges csv file.</li> | |
| − | + | <li>Name the column "id", so that Gephi can detect the ids of the nodes.</li> | |
| − | + | <li>Add the label as name of the employee involved in the transaction</li></ol> | |
| − | |||
| − | |||
| − | |||
| − | |||
| − | |||
| − | |||
| − | To create the | ||
| − | |||
| − | |||
| − | |||
| − | |||
| − | |||
| − | |||
| − | |||
| − | |||
| − | |||
| − | |||
| − | |||
</div> | </div> | ||
Latest revision as of 12:22, 8 July 2018

Communication Data
Initial part of our analysis requires us to explore the communication pattern of the company. In order to analyse the pattern, we have to combine the four-communication dataset of Kasios into one single data to have the holistic view.
Using Tableau prep all the four data can be merged and transformed into our necessary format.
The date format of the data has been given in Unix epoch timestamp beginning from May 11, 2015 at 14:00. To transform this into our timestamp value we can derive the following calculated field,
Network Data
Once we transform our data we can explore the communication pattern and growth of the company with this merged dataset.
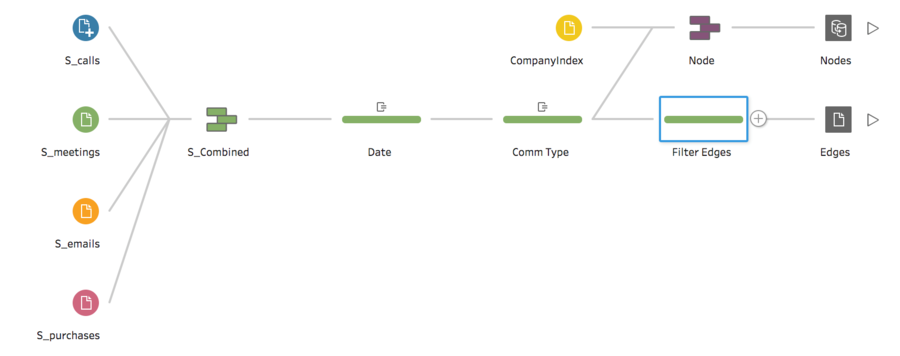
For our later part of the analysis the data has to be transformed in such a way that it would be readable on Gephi for basic network visualisations. Using the insider kasios suspicious data, I created edges and nodes for our network visualization.
The following flow shows the data processing involved in this process using Tableau prep,
Aggregated Communication Data
To create the edges csv file:
- Concatenate communication data for all different transactions into one source of information.
- Change column data type of "From" and "To" from continuous to nominal.
- Rename columns "From" and "To" to "Source" and "Target".
- Create a column "Type" and ensure that all the fields of the column are filled with "Directed" - This helps to specify the direction of the communication.
- Create a new column with the formula "Source || Target", as this concatenates the Source and Target column.
- Use the tabulate function to count the number of times the concatenated cell appears in the column - this helps to find out the weight of the unique direction of communication.
- Update the table with the weight of the column. Change the column name to "Weight".
To create the nodes csv file:
- Merge the company index with the combined file together and find out the unique nodes present in the edges csv file.
- Name the column "id", so that Gephi can detect the ids of the nodes.
- Add the label as name of the employee involved in the transaction