Difference between revisions of "ISSS608 2016-17 T3 Assign APARAJITA SHUKLA Visualizations"
(Created page with "<div> 300px <font size = 5; font color="#21618C"> VAST Challenge: Mini Challenge 2</font> </div> <div sty...") |
(aaa) |
||
| Line 97: | Line 97: | ||
| − | + | 2016- Reading | |
| − | |||
| − | |||
| − | + | In Year 2016, Somchair can be seen to have the highest level of contamination of methylosmolene in the water. But this year the contamination value has increased to 130.5 ug/l. This increase surely shows that something around Somchair and Kohsoom is definitely happening which is causing this exponential increase in the value of contamination in the water. | |
| + | Contamination in Kohsoom can also be seen increasing over years, with the new value being 58.2 ug/l (6.4 ug/l in 2015) | ||
| − | [[Image: | + | [[Image:Sp.png|300px]] |
| − | + | The highlighted rows above only represent the places where the presence of methylosmolene in water was seen increasing. Here, Somchair can be seen with a peculiar increase in % value of the contamination in the water. | |
| − | + | '''AGOC-3A''' | |
| − | |||
| − | |||
| − | + | Moving on to AGOC-3A, this chemical just like Methylosmolene is first seen in records starting from year 2014. | |
| − | |||
| + | [[Image:Aap.png|300px]] | ||
| − | |||
| − | + | 2014-Reading(AGOC-3A) | |
| − | |||
| − | |||
| − | + | In year 2014 the presence of AGOC-3A was noticed in all the areas excluding Decha, Tansanee and Achara. | |
| + | Among all the places Chai was seen to have the highest level of AGOC-3A and then Kannika. | ||
| − | [[Image: | + | |
| + | [[Image:Asp.png|300px]] | ||
| + | |||
| + | |||
| + | 2015-Reading(AGOC-3A) | ||
| + | |||
| + | |||
| + | In 2015 a sudden spike was seen in Boonsri where the level of AGOC-3A came up to 9.96 ug/l from 0.321 ug/l and If noticed properly, Boonsri, Chai, Kannika all are liked together through the river channel. We still can’t say which place exactly is the source of this contamination as the direction of river is unknown. | ||
| + | |||
| + | |||
| + | [[Image:Ma.png|300px]] | ||
| + | |||
| + | |||
| + | 2016- Reading(AGOC-3A) | ||
| + | |||
| + | |||
| + | Now this chart here shows that Boonsri is no longer in the first position whereas Buskarkhan and Somchair has again emerged to be the cities with highest contamination. | ||
| + | |||
| + | |||
| + | '''Chlorodinine:''' | ||
| + | |||
| + | Another talked about chemical in the last year challenge was Chlorodinine. | ||
| + | |||
| + | |||
| + | [[Image:Maa.png|300px]] | ||
| + | |||
| + | |||
| + | 2014- Reading(Chlorodinine) | ||
| + | |||
| + | |||
| + | As one can see here Chlorodinine is omnipresent except the three places Decha, Tansanee and Achara. Also, the contamination level is almost similar everywhere. | ||
| + | Among all, Somchair has the maximum contamination level i.e. 0.2576ug/l. | ||
| + | |||
| + | |||
| + | [[Image:Mas.png|300px]] | ||
| + | |||
| + | |||
| + | 2015- Reading(Chlorodinine) | ||
| + | |||
| + | |||
| + | |||
| + | In 2015, again the contamination level has almost remain the same but this time Busarkhan has topped the chart with Chlorodinine level of 0.2790 ug/l and Somchair 0.2534 ug/l which less than the 2014 year. Whereas, Busarkhan’s level of contamination has increased from 0.2556 to 0.2790ug/l i.e. 8% increase. | ||
| + | |||
| + | |||
| + | [[Image:Sam.png|300px]] | ||
| + | |||
| + | 2016- Reading(Chlorodinine) | ||
| + | |||
| + | In 2016 the level of contamination has come down drastically in all the places around. | ||
| + | |||
| + | |||
| + | [[Image:Aapp.png|300px]] | ||
| + | |||
| + | |||
| + | The table above shows that in 2015 there were few places where the level of Chlorodinine went high in comparison to 2014 and some where it went down. | ||
| + | But, in 2016 the contamination level for all the places has dropped. | ||
| + | This sudden drop of chlorodinine level in all the cities suggest that if it was coming out from a factory then probably the factory has chosen some other chemical to replace it. | ||
Revision as of 11:16, 8 July 2018
VAST MINI CHALLENGE 2:
Like a Duck to Water
|
|
|
|
Question 1
Characterize the past and most recent situation with respect to chemical contamination in the Boonsong Lekagul waterways. Do you see any trends of possible interest in this investigation?
As the main concern of the professors was to not able to find the presence of methylosmolene in from the soil sample, we will initiate our investigation starting from looking for the presence of hazardous chemical methylosmolene in the water.
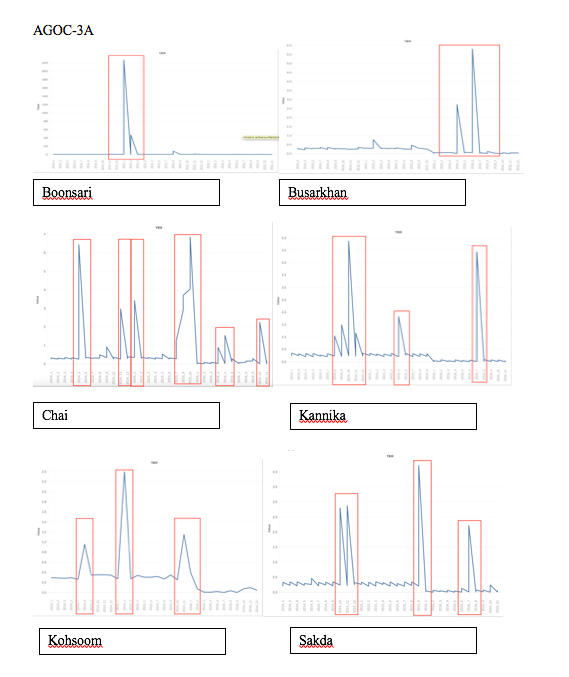
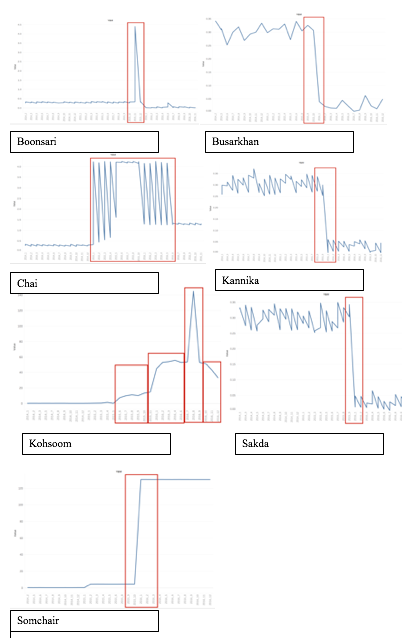
The line charts provided above gives us a macro view of months cross years. All the graphs above shows the concentration of AGOC-3A present in different areas. The spikes marked with red rectangle shows the month where the reading of AGOC-3A was out of ordinary from the usual readings.
Chlorodinine
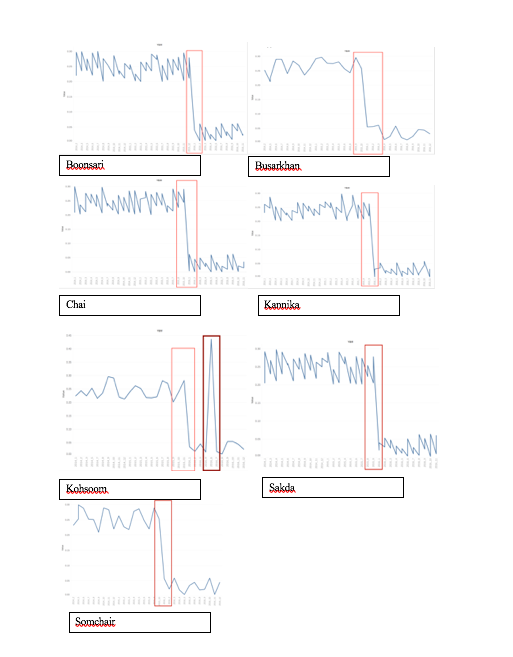
The line charts provided above gives us a macro view of months cross years. All the graphs above shows the concentration of Cholorodinine present in different areas. The spikes marked with red rectangle shows the month where the reading of AGOC-3A was out of ordinary from the usual readings.
Also, we can see all the graphs above follow a particular trend except the graph of Kohsoom.
Methylosmolene
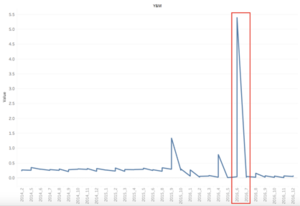
The line charts provided above gives us a macro view of months cross years. All the graphs above shows the concentration of Methylosmolene present in different areas. The spikes marked with red rectangle shows the month where the reading of AGOC-3A was out of ordinary from the usual readings. Busarkkhan , Kannika and Sakda show a similar pattern to Chlorodinine whereas Somchai shows a constant level of contamination starting from 2015 October till date.
Methylosmolene
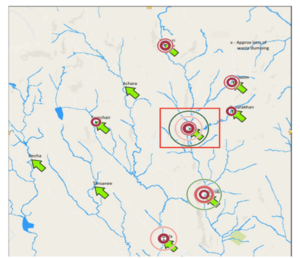
2014-Reading
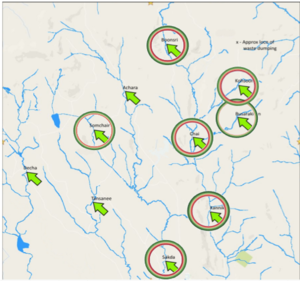
From the data set provided, it has been noticed that the presence of Methylosmolene first
Seen in the year 2014, where Kannika marked above was found containing the maximum amount of Methylosmolene i.e. 0.371 ug/l.
However three places namely Achara, Tansanee and Decha did not have any record to testify if methylosmolene was present in the water around them or not.
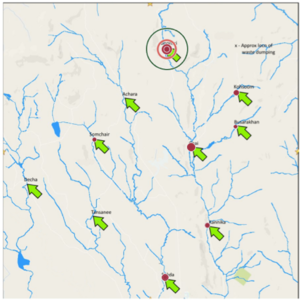
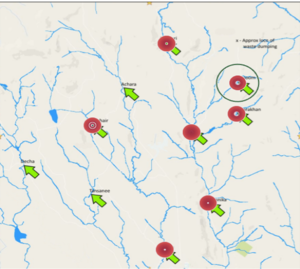
2015-Reading
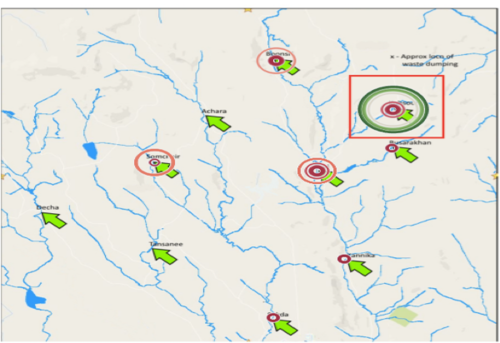
In year 2015 we can see that the presence of methlyosmolene at Kohsoom has topped the list of having the most amount of presence of methlyosmolene in water, increased to 6.4 ug/l from 0.345 ug/l (2014), If seen properly, one can notice that Kohsoom is quite close to the dumping area marked in the map. This increase is also seen in other areas like Somchair.
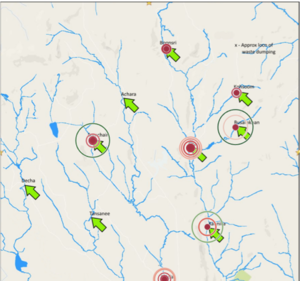
2016- Reading
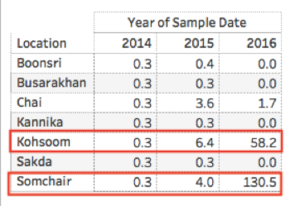
In Year 2016, Somchair can be seen to have the highest level of contamination of methylosmolene in the water. But this year the contamination value has increased to 130.5 ug/l. This increase surely shows that something around Somchair and Kohsoom is definitely happening which is causing this exponential increase in the value of contamination in the water. Contamination in Kohsoom can also be seen increasing over years, with the new value being 58.2 ug/l (6.4 ug/l in 2015)
The highlighted rows above only represent the places where the presence of methylosmolene in water was seen increasing. Here, Somchair can be seen with a peculiar increase in % value of the contamination in the water.
AGOC-3A
Moving on to AGOC-3A, this chemical just like Methylosmolene is first seen in records starting from year 2014.
2014-Reading(AGOC-3A)
In year 2014 the presence of AGOC-3A was noticed in all the areas excluding Decha, Tansanee and Achara.
Among all the places Chai was seen to have the highest level of AGOC-3A and then Kannika.
2015-Reading(AGOC-3A)
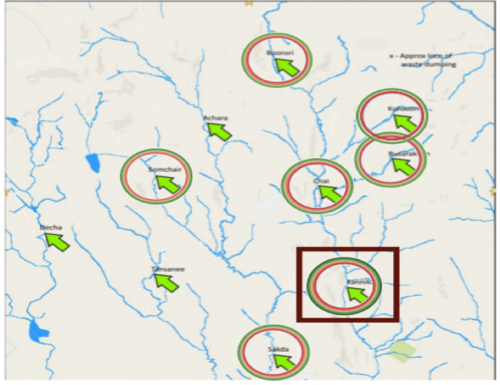
In 2015 a sudden spike was seen in Boonsri where the level of AGOC-3A came up to 9.96 ug/l from 0.321 ug/l and If noticed properly, Boonsri, Chai, Kannika all are liked together through the river channel. We still can’t say which place exactly is the source of this contamination as the direction of river is unknown.
2016- Reading(AGOC-3A)
Now this chart here shows that Boonsri is no longer in the first position whereas Buskarkhan and Somchair has again emerged to be the cities with highest contamination.
Chlorodinine:
Another talked about chemical in the last year challenge was Chlorodinine.
2014- Reading(Chlorodinine)
As one can see here Chlorodinine is omnipresent except the three places Decha, Tansanee and Achara. Also, the contamination level is almost similar everywhere.
Among all, Somchair has the maximum contamination level i.e. 0.2576ug/l.
2015- Reading(Chlorodinine)
In 2015, again the contamination level has almost remain the same but this time Busarkhan has topped the chart with Chlorodinine level of 0.2790 ug/l and Somchair 0.2534 ug/l which less than the 2014 year. Whereas, Busarkhan’s level of contamination has increased from 0.2556 to 0.2790ug/l i.e. 8% increase.
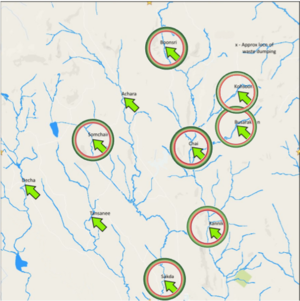
2016- Reading(Chlorodinine)
In 2016 the level of contamination has come down drastically in all the places around.
The table above shows that in 2015 there were few places where the level of Chlorodinine went high in comparison to 2014 and some where it went down.
But, in 2016 the contamination level for all the places has dropped.
This sudden drop of chlorodinine level in all the cities suggest that if it was coming out from a factory then probably the factory has chosen some other chemical to replace it.
