Difference between revisions of "ISSS608 2017-18 T3 Assign Lim Wee Kiong Data Preparation"
Jump to navigation
Jump to search

Wklim.2017 (talk | contribs) |
Wklim.2017 (talk | contribs) |
||
| Line 63: | Line 63: | ||
|} | |} | ||
| + | A sample of the data is shown here: | ||
| + | [[Image:LWKdataprep1.jpg|center|300px]] | ||
| + | |||
| + | There are a total of 136,825 sample data points across 104 different measures. | ||
| + | |||
| + | The chemical units of measure csv file is basically the measures with an additional field for the units of measurement. The sample data is as shown below: | ||
Back to Dropbox Page | Back to Dropbox Page | ||
[[File:Go back.png|40px|frameless|left|link=Assignment_Dropbox_G1]] | [[File:Go back.png|40px|frameless|left|link=Assignment_Dropbox_G1]] | ||
Revision as of 07:25, 8 July 2018
 VAST 2018 Mini-Challenge 2: Like a Duck to Water
|
|
|
|
|
|
|
Data Preparation
Understanding the Raw Data – Samples Readings and Measures
The data given to us comes in 2 main files: Boonsong Lekagul waterways readings.csv and chemical units of measure.csv.
Data cleaning is done in Excel and data visualization in Tableau.
Descriptions of the data fields for Boonsong Lekagul waterways readings are as follow:
| Field | Description |
|---|---|
| ID | Identification number for the record (only for bookkeeping) |
| Value | Measured value for the chemical or property in this record |
| Location | Name of the location sample was taken from. See the map for geo-location of the sampling site. |
| Sample Date | Date sample was taken from the location |
| Measure | Chemicals (e.g., Sodium) or water properties (e.g., Water temperature) measured in the record |
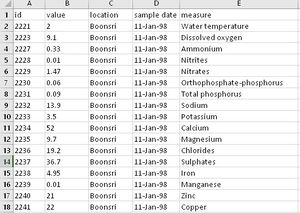
A sample of the data is shown here:

There are a total of 136,825 sample data points across 104 different measures.
The chemical units of measure csv file is basically the measures with an additional field for the units of measurement. The sample data is as shown below:
Back to Dropbox Page