Difference between revisions of "ISSS608 2017-18 T3 Assign Low Zhi Wei Visualisations"
(→Iron) |
|||
| Line 79: | Line 79: | ||
The immediate observation is that the outliers all coincide on the same day of measurement. This indicates either the possibility of a macro-level event which resulted in a massive release of Iron into the soil, or an error in the sampling to testing process to determine the values for Iron. In the case of the former, it is reasonable to expect such a large-scale event to also have a longer lasting impact on the soil as chemicals do not biodegrade overnight or a few days. However, the outliers exist simply on their own with no signs of high readings in the following collected samples. | The immediate observation is that the outliers all coincide on the same day of measurement. This indicates either the possibility of a macro-level event which resulted in a massive release of Iron into the soil, or an error in the sampling to testing process to determine the values for Iron. In the case of the former, it is reasonable to expect such a large-scale event to also have a longer lasting impact on the soil as chemicals do not biodegrade overnight or a few days. However, the outliers exist simply on their own with no signs of high readings in the following collected samples. | ||
| − | =<font size = 3; color = "#326569">Metals and 15 Aug 2003</font>= | + | ====<font size = 3; color = "#326569">Metals and 15 Aug 2003</font>==== |
| − | With the assumption that a large-scale event should have other indicators of residual impact, further investigation into the date was conducted. Comparing readings in the neighbourhood of the date, the following chart illustrates the impact of this event - other metals also registered a large spike in their respective readings. Yet, these outliers also existed on their own with no higher readings in the following collections. This defies logic from an ecological perspective, so it is more likely determined to be an error with the sampling collection process. | + | With the assumption that a large-scale event should have other indicators of residual impact, further investigation into the date was conducted. Comparing readings in the neighbourhood of the date, the following chart illustrates the impact of this event - all other metals (Chromium, Copper, Manganese, Nickel, and Zinc) also registered a large spike in their respective readings. Yet, these outliers also existed on their own with no higher readings in the following collections. This defies logic from an ecological perspective, so it is more likely determined to be an error with the sampling collection process. |
[[Image:ZW-15 Aug 2003.png|800px]] | [[Image:ZW-15 Aug 2003.png|800px]] | ||
| − | ==<font size = 3; color = "#326569"> | + | ==<font size = 3; color = "#326569">Zinc</font>== |
| + | The final suspect outlier: | ||
| + | #Reading for Zinc in Kohsoom on 25 Feb 2011 indicates a value of 915 mg/l. | ||
| + | |||
| + | [[Image:ZW-Chart Zinc Kohsoom.png|800px]] | ||
| + | |||
| + | Similar to the evaluation for Total coliforms, there only exists 1 sample reading per day for Zinc. This lack of corroborative evidence casts a strong shadow of doubt on the legitimacy of this outlier being an actual significant ecological event with impact to the wildlife. | ||
| + | |||
| + | =<font color = "#326569">Findings 3 - Methylosmoline</font>= | ||
placeholder | placeholder | ||
| − | =<font color = "#326569">Findings | + | |
| + | |||
| + | =<font color = "#326569">Findings 4 - Kohsoom & Tansanee</font>= | ||
placeholder | placeholder | ||
Revision as of 03:16, 8 July 2018
Through the use of a few specific types of visualisations, and a deep-dive into each individual chemical, a few findings and insights were uncovered around the climate of the reserve, potential gaps and opportunities of improvement for sampling, fluctuations in Methylosmoline, and some other chemicals of interest. These findings are presented below.
Contents
Findings 1 - Climate
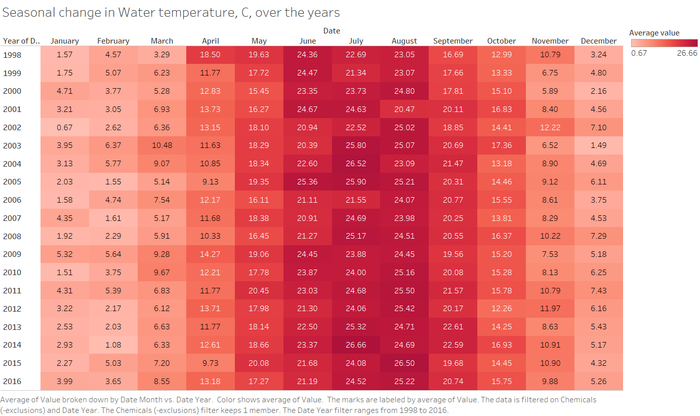
The water temperature varies seasonally over each year. This makes sense intuitively as the temperature of water would rise and fall in accordance to climate changes. From the chart below, warmer parts of the year are from June to August, while the cold months are from December to February.
Impact on other chemicals
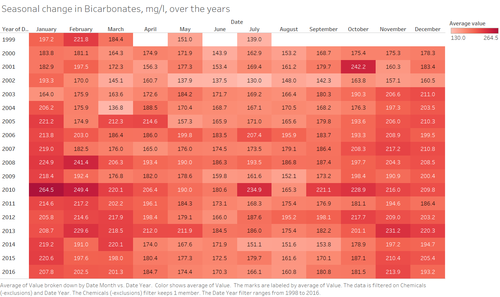
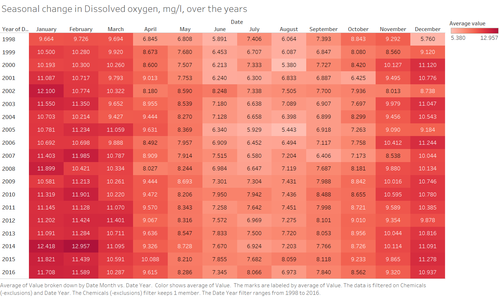
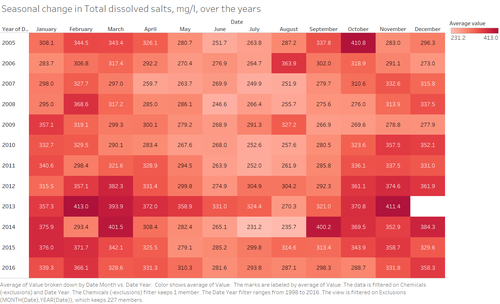
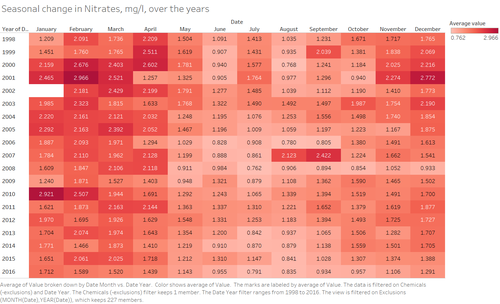
With the variations in climate, there also appears to be a similar but inverse pattern of variation on a few chemicals, which hints that temperature of the environment may have a subtle effect on the naturally occurring quantities of these chemicals in the soil.
Note: Uppermost extreme values for Total dissolved salts and Nitrates were excluded to enable greater visual differentiation of intra-year variations.
Findings 2 - Data outliers and potential sampling issues
While this exercise seeks to find patterns of interest, which includes extremities in fluctuations, it is important to also be mindful of the fact that such outliers may be potential errors arising from inherent data deficiencies.
The following charts present a few outliers which are suspect.
Total Coliforms
Key outliers in question:
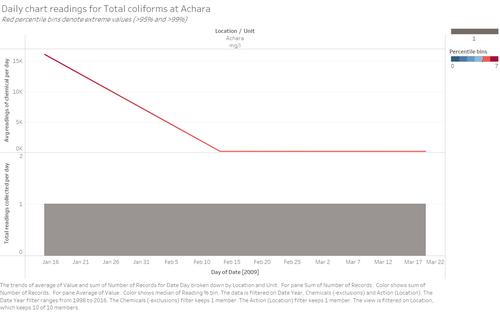
- Reading for Total Coliforms in Achara on 15 Jan 2009 indicates a value of 16090 mg/l.
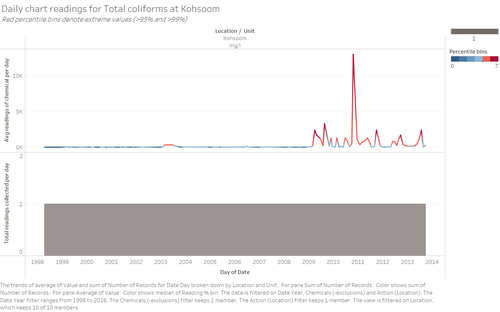
- Reading for Total Coliforms in Kohsoom on 20 Oct 2010 indicates a value of 13000 mg/l.
In comparison, most of the values for the other readings fall below 1000 mg/l. Considering the unit of measure, the increase is effectively more than 10 grams per litre. At both locations, the daily sample collected is only 1 per day, so there is no additional data to corroborate the evidence or rule out errors in sample collection. In the case of Achara, there are also only a total of 3 readings over the entire span of 18 years which creates an absence of benchmark norms. Given the circumstances, it is risky to draw any conclusions from these 2 outliers.
Iron
Key outliers in question:
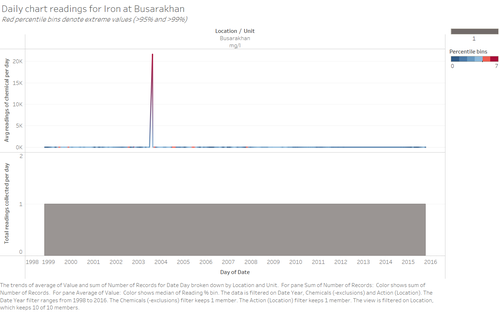
- Reading for Iron in Busarkhan on 15 Aug 2003 indicates a value of 21666 mg/l.
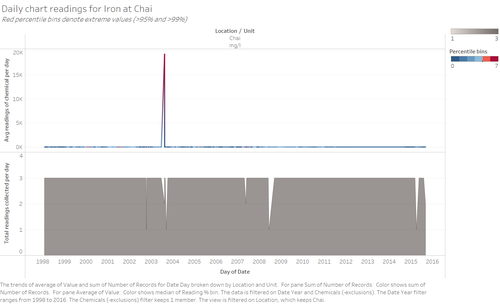
- Reading for Iron in Chai on 15 Aug 2003 indicates a value of 19329 mg/l.
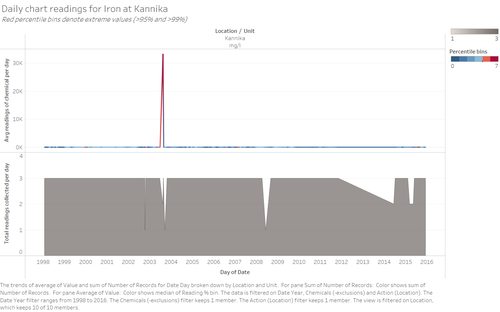
- Reading for Iron in Kannika on 15 Aug 2003 indicates a value of 33208 mg/l.
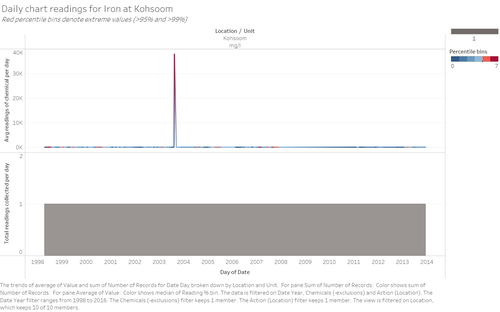
- Reading for Iron in Kohsoom on 15 Aug 2003 indicates a value of 37959 mg/l.
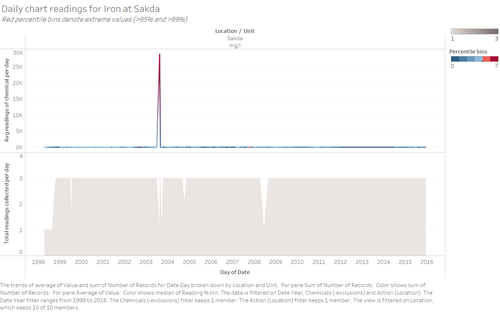
- Reading for Iron in Sakda on 15 Aug 2003 indicates a value of 28902 mg/l.
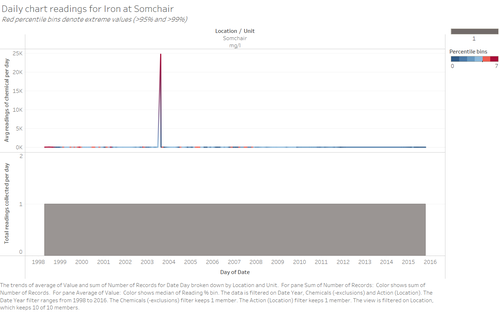
- Reading for Iron in Somchair on 15 Aug 2003 indicates a value of 24791 mg/l.
The immediate observation is that the outliers all coincide on the same day of measurement. This indicates either the possibility of a macro-level event which resulted in a massive release of Iron into the soil, or an error in the sampling to testing process to determine the values for Iron. In the case of the former, it is reasonable to expect such a large-scale event to also have a longer lasting impact on the soil as chemicals do not biodegrade overnight or a few days. However, the outliers exist simply on their own with no signs of high readings in the following collected samples.
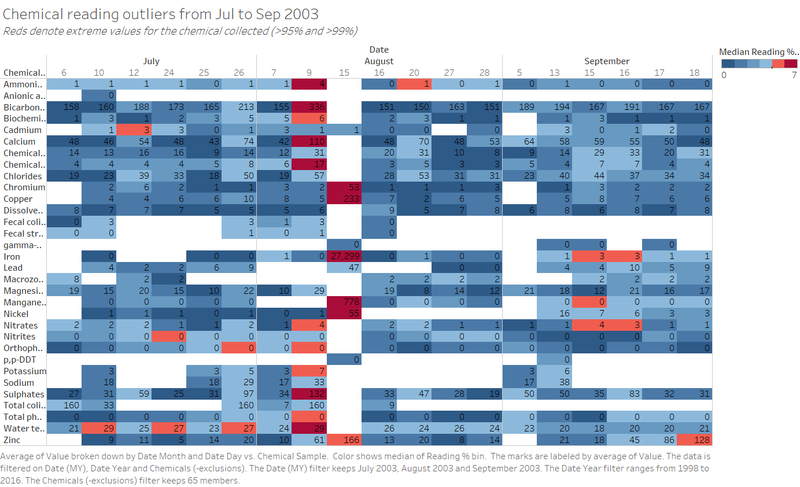
Metals and 15 Aug 2003
With the assumption that a large-scale event should have other indicators of residual impact, further investigation into the date was conducted. Comparing readings in the neighbourhood of the date, the following chart illustrates the impact of this event - all other metals (Chromium, Copper, Manganese, Nickel, and Zinc) also registered a large spike in their respective readings. Yet, these outliers also existed on their own with no higher readings in the following collections. This defies logic from an ecological perspective, so it is more likely determined to be an error with the sampling collection process.
Zinc
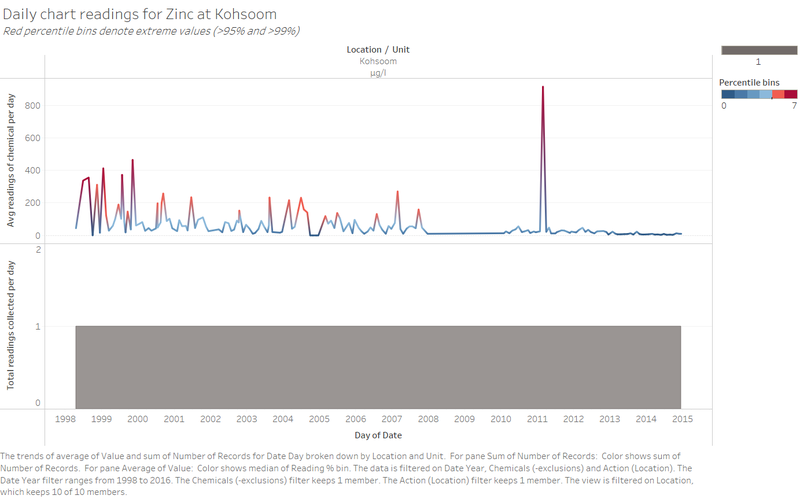
The final suspect outlier:
- Reading for Zinc in Kohsoom on 25 Feb 2011 indicates a value of 915 mg/l.
Similar to the evaluation for Total coliforms, there only exists 1 sample reading per day for Zinc. This lack of corroborative evidence casts a strong shadow of doubt on the legitimacy of this outlier being an actual significant ecological event with impact to the wildlife.
Findings 3 - Methylosmoline
placeholder
Findings 4 - Kohsoom & Tansanee
placeholder
