Difference between revisions of "ISSS608 2017-18 T3 Assign Low Zhi Wei Visualisations"
Jump to navigation
Jump to search
| Line 31: | Line 31: | ||
=<font color = "#326569"><br/>Findings 1</font>= | =<font color = "#326569"><br/>Findings 1</font>= | ||
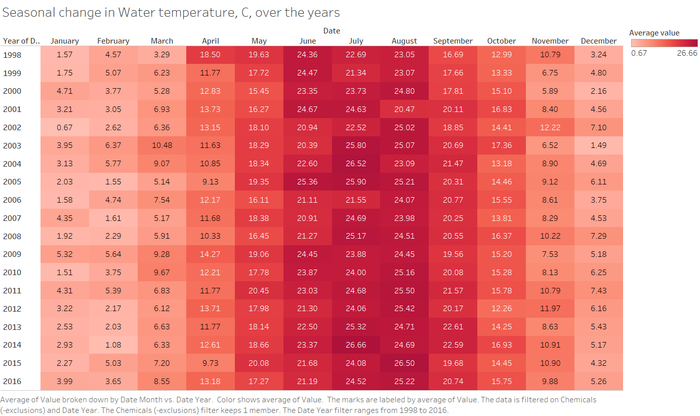
| − | + | The water temperature varies seasonally over each year. This makes sense intuitively as the temperature of water would rise and fall in accordance to climate changes. From the chart below, warmer parts of the year are from June to August, while the cold months are from December to February. | |
| + | |||
| + | [[Image:ZW-Water Temp by month.png|700px]] | ||
==<font size = 3; color = "#326569">subhead 1</font>== | ==<font size = 3; color = "#326569">subhead 1</font>== | ||
Revision as of 00:45, 8 July 2018
Contents
Findings 1
The water temperature varies seasonally over each year. This makes sense intuitively as the temperature of water would rise and fall in accordance to climate changes. From the chart below, warmer parts of the year are from June to August, while the cold months are from December to February.
subhead 1
placeholder
subhead 2
placeholder
Findings 2
placeholder
subhead 1
placeholder
subhead 2
placeholder
Findings 3
placeholder

